
What Is Stagflation? Definition, Causes and 1970s Example
By Josh Heine, Content Strategist at Simple Mining
Published October 27, 2026
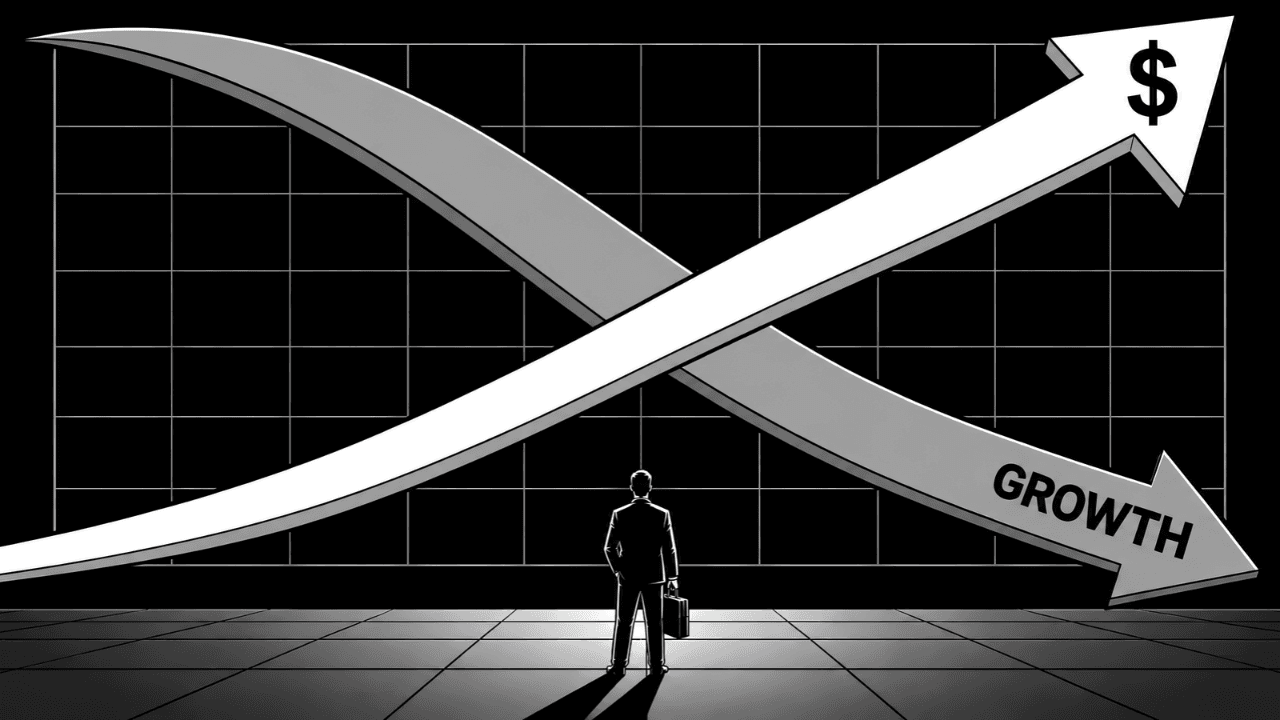
Stagflation is the rare mix of rising prices, slowing growth, and higher unemployment at the same time. The US lived through it in the 1970s, when two oil shocks and loose monetary policy pushed inflation into double digits while unemployment climbed. It's hard to escape, because the usual cure for one problem makes the other worse.
On this page · 11 sections
- What Is Stagflation?
- What Causes Stagflation?
- What Caused Stagflation in the 1970s?
- Why Is Stagflation So Rare?
- Stagflation vs. Inflation vs. Recession
- What Are the Warning Signs of Stagflation?
- Are We in Stagflation?
- How Does the Fed Fight Stagflation?
- What Does Stagflation Mean for Bitcoin Miners?
- FAQs About Stagflation
- Mine Bitcoin Through Any Economic Cycle
Key Takeaways
- Stagflation means rising prices, slowing growth, and higher unemployment together, a rare combination.
- In the 1970s, supply shocks such as oil price spikes started it, and policy mistakes and rising inflation expectations made it worse.
- Two oil shocks in the 1970s helped push US CPI inflation to a peak of 14.8% in March 1980.
- Paul Volcker's Fed broke the cycle with a federal funds rate that climbed to almost 20%, while unemployment reached 10.8% in late 1982.
- For Bitcoin miners, stagflation is a cost squeeze: they earn Bitcoin but pay for power and hardware in dollars.
What Is Stagflation?
Stagflation is economic stagnation, meaning higher unemployment and slowing growth, plus rising inflation at the same time. In practice, stagflation occurs when high inflation combines with slowing growth and higher unemployment, so households pay more while jobs get harder to find. It's also rare. The Cleveland Fed's explainer on stagflation notes that the US had bouts during the 1973 to 1975 and 1980 recessions.
British Conservative MP Iain Macleod is credited with coining the word in a House of Commons debate on November 17, 1965, when he called inflation and stagnation together "the worst of both worlds." Three conditions show up at once:
- Stagnant growth: The economy's output grows little or stalls.
- Rising unemployment: More people want work and can't find it.
- Rising prices: Inflation stays high or climbs, so each dollar buys less.
Rising prices, weak growth, and job losses are each common on their own. All three at once is what makes the combination unusual and hard to treat.
What Causes Stagflation?
In the 1970s, stagflation came from supply shocks that raised costs while output fell, made worse by policy mistakes and rising inflation expectations. The three feed each other: a shock lifts prices, policy accommodates it, and expectations lock it in.
Supply Shocks
A supply shock is an event that raises the cost of producing goods or cuts how much an economy can make. Unlike a demand boom, which lifts prices and output together, it pushes prices up while output falls. Oil is the classic case, because energy goes into almost everything. The two oil shocks of the 1970s, covered below, follow this pattern.
Policy Mistakes
Monetary policy, a central bank's control of interest rates and the money supply, can turn a shock into a long episode. In the late 1960s and 1970s, policymakers believed there was a stable, exploitable trade-off between unemployment and inflation. That belief led to policy that tolerated rising prices in the hope of keeping unemployment low. Wage and price controls slowed the rise in prices, but only for a time.
Wage-Price Spirals and Expectations
In a wage-price spiral, higher prices lead workers to demand raises, and the raises lead businesses to lift prices again. The same loop sits at the center of the debate over whether UBI would cause inflation. When inflation expectations are anchored, people trust prices to settle back, so a shock fades. When they come unanchored, workers and businesses build higher inflation into every wage deal and price tag, and the shock feeds on itself.
What Caused Stagflation in the 1970s?
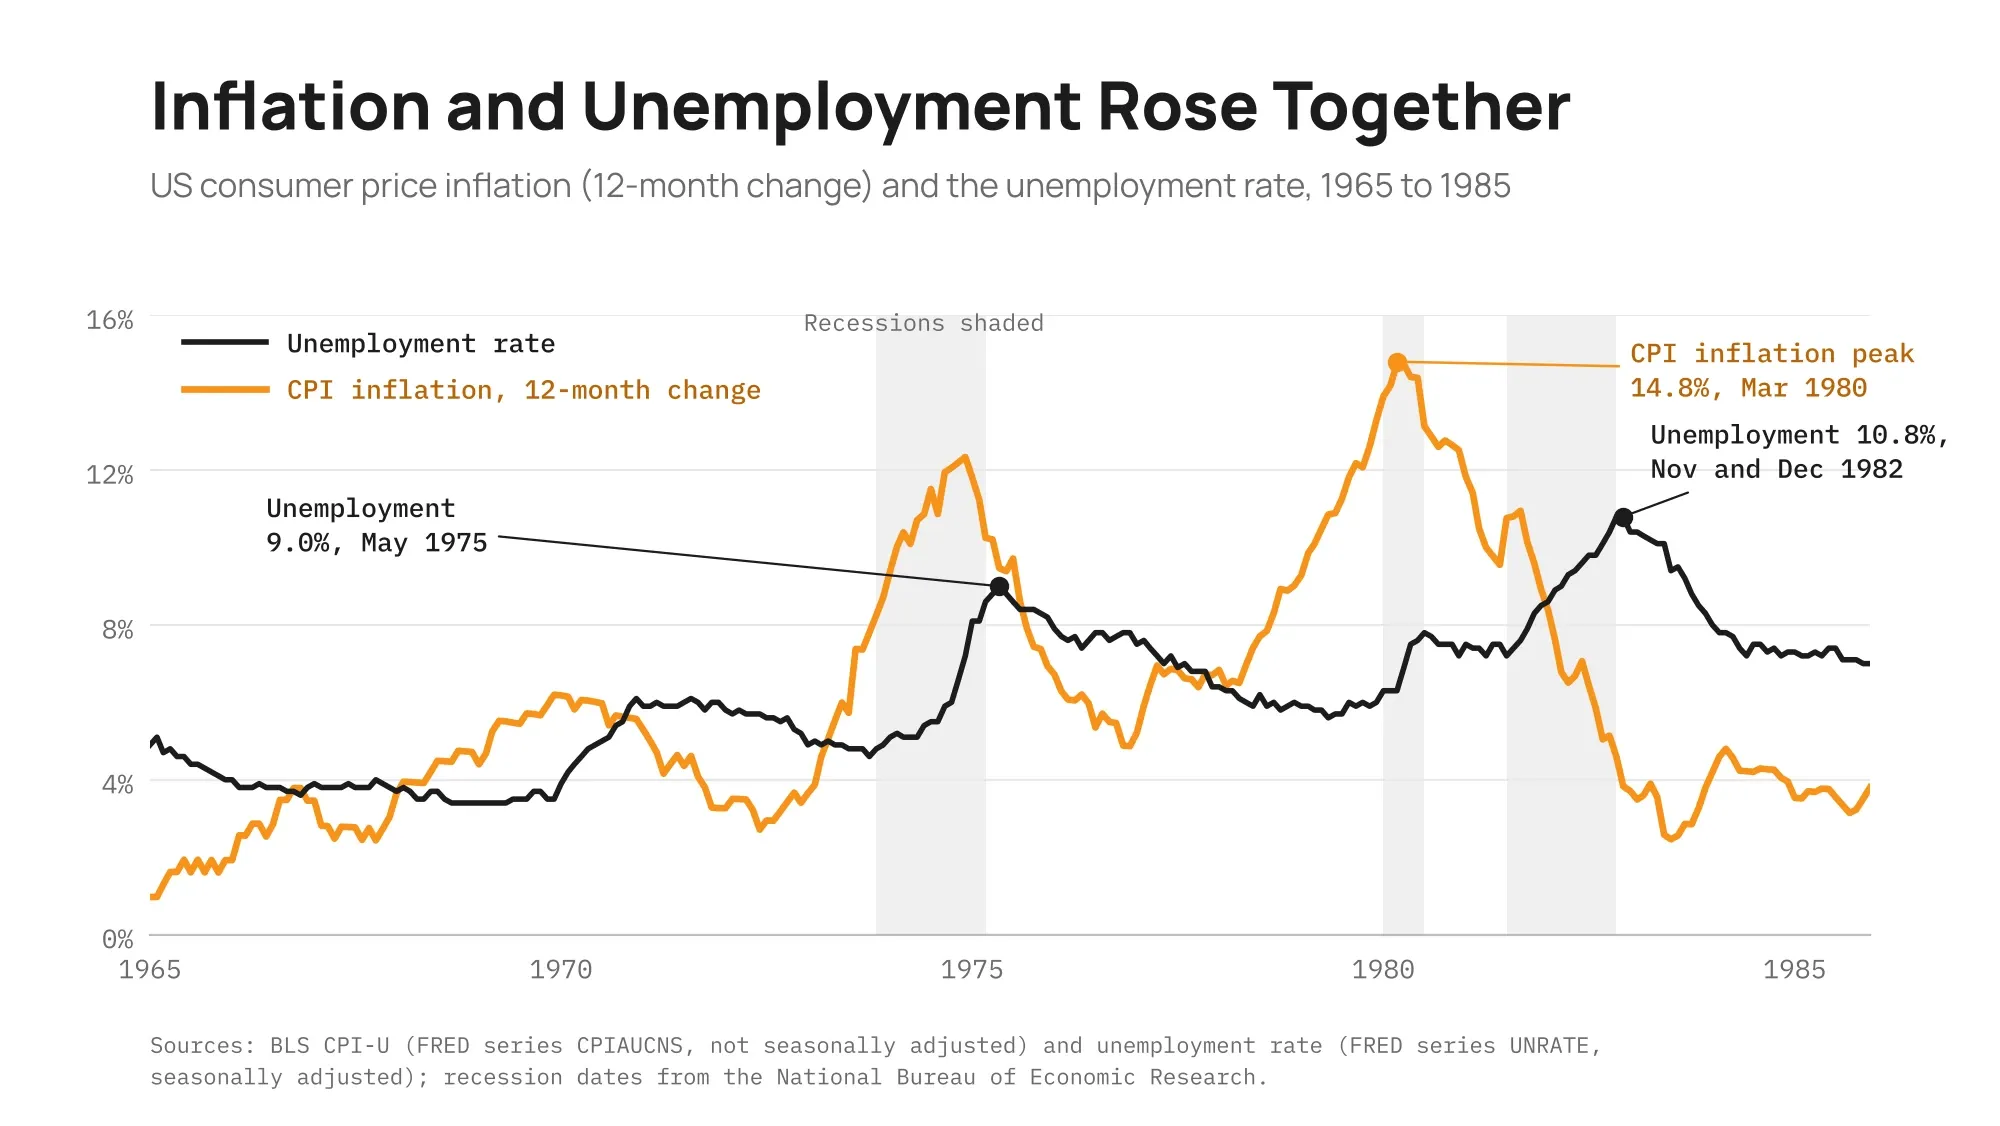
The 1970s stagflation came from two oil shocks on top of loose monetary policy. It arrived in bouts, during the 1973 to 1975 and 1980 recessions, inside the Great Inflation that Federal Reserve History dates from 1965 to 1982. The chart below tracks US inflation and unemployment from 1965 to 1985.
The Nixon Shock and Price Controls
On August 15, 1971, President Nixon announced a 90-day freeze on wages and prices as part of the Nixon shock. Mandatory wage and price controls then stayed in place, in stages, until April 30, 1974.
The 1973 Oil Embargo
In October 1973, during the Arab-Israeli War, Arab oil exporters imposed an embargo on the United States over its support for Israel and kept it until March 1974. Oil prices quadrupled, from $2.90 a barrel before the embargo to $11.65 in January 1974, according to Federal Reserve History's account of the 1973 to 1974 oil shock. CPI inflation reached 12.3% in the 12 months through December 1974. Unemployment climbed to 9.0% in May 1975, two months after the recession ended.
The 1979 Oil Shock
The second shock came with the Iranian Revolution. By January 1979, Iranian oil output had fallen by 4.8 million barrels a day, 7% of world production at the time. Oil prices more than doubled between April 1979 and April 1980. US CPI inflation peaked at 14.8% in March 1980, and a short recession ran from January to July 1980.
The Volcker Shock
Paul Volcker became Fed Chairman on August 6, 1979. On October 6, he announced that the Fed would manage the volume of bank reserves instead of the day-to-day federal funds rate, a shift covered in Federal Reserve History's essay on the Fed's anti-inflation measures. The federal funds rate climbed to almost 20%, with a monthly average peak of 19.10% in June 1981. The rate climb and the recessions that followed are known as the Volcker shock.
The economy fell back into recession from July 1981 to November 1982, and unemployment reached 10.8% in November and December 1982. CPI inflation fell to 3.8% by December 1982. The lesson: high rates worked, but the cure cost jobs.
Why Is Stagflation So Rare?
Stagflation is rare, and it broke the Phillips curve, the idea that inflation and unemployment move in opposite directions. In a 1958 paper, economist A.W. Phillips examined UK unemployment and wages from 1861 to 1957 and found an inverse relationship between unemployment and wage growth. Policymakers came to treat it as a trade-off they could exploit, buying lower unemployment with a little more inflation, as Federal Reserve History's account of the Great Inflation explains.
Milton Friedman argued in his December 29, 1967 address to the American Economic Association that the trade-off is only temporary, and Edmund Phelps warned the same that year. The 1970s bore them out, as inflation and unemployment rose together. In Federal Reserve History's words, "The trade-off that policymakers hoped to exploit did not exist."
Stagflation vs. Inflation vs. Recession
Stagflation combines the rising prices of inflation with the weak growth and rising unemployment of a recession.
| Condition | Prices | Growth | Unemployment |
|---|---|---|---|
| Stagflation | Rising | Slowing | Rising |
| Inflation | Rising | Often growing | Often low |
| Recession | Often cooling | Falling | Rising |
| Deflation | Falling, a sustained decrease | Often weak | Often rising |
| Hyperinflation | More than 50% a month | Collapsing | Rising |
Stagflation is harder to fix than an ordinary recession, because the usual remedies pull in opposite directions. Lower interest rates support growth and jobs but can feed inflation, while higher rates cool prices but can cost jobs. A central bank in that bind has to choose which problem to fight first.
Deflation is the opposite problem, and AI deflation is the idea that artificial intelligence could push the whole price level down. At the other extreme, inflation running past 50% a month becomes hyperinflation, where the currency itself breaks down.
What Are the Warning Signs of Stagflation?
The warning signs of stagflation are rising inflation, rising unemployment, and slowing growth showing up in the data at the same time. These five indicators track them:
| Indicator | What it measures | Where to find it |
|---|---|---|
| Headline and core CPI | Consumer prices; core CPI covers all items less food and energy | Bureau of Labor Statistics (BLS) |
| Unemployment rate | The share of the labor force out of work and looking for a job | BLS |
| Real GDP | Economic output, adjusted for inflation | Bureau of Economic Analysis (BEA) |
| Inflation expectations | What consumers expect prices to do | University of Michigan Surveys of Consumers |
| Energy prices | Oil and other fuel costs | Energy Information Administration (EIA) |
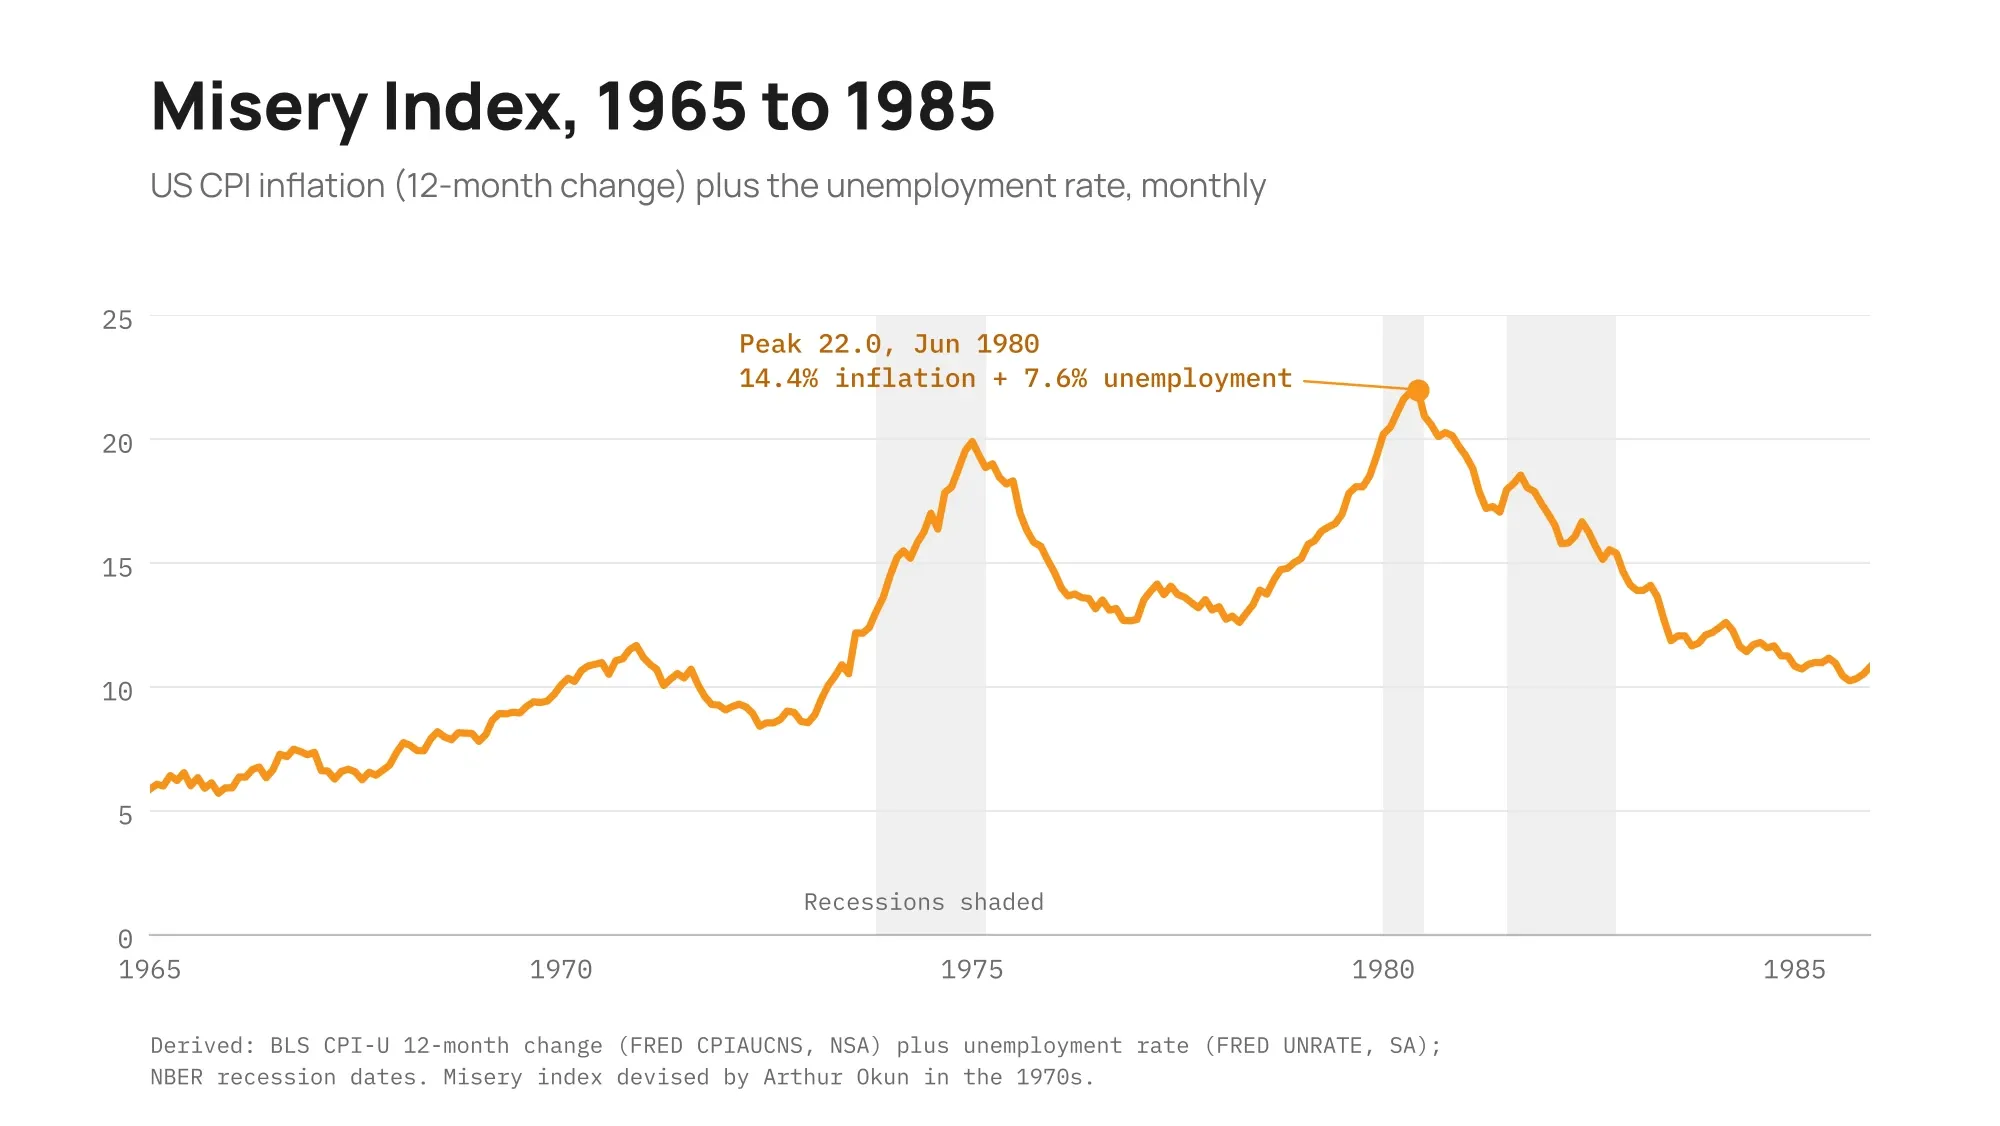
A quick shortcut is the misery index, the inflation rate plus the unemployment rate, which economist Arthur Okun devised in the 1970s. Read headline and core CPI side by side: when energy lifts the headline rate while core stays steadier, the shock has not spread across the economy yet. No single report settles the question.
Are We in Stagflation?
Not as of late October 2026: the US faces a stagflation-style energy shock, but the data don't show stagflation. The difference matters: an energy shock can fade, while stagflation also needs weak growth and rising unemployment.
The case for:
- CPI rose 3.7% in the 12 months through September 2026, and the CPI energy index rose 20.4%.
- Brent crude averaged $114 a barrel in September 2026, and year-ahead inflation expectations rose to 4.7% in the University of Michigan's final October survey.
- The FOMC raised its federal funds target range by 25 basis points to 3.75% to 4.00% on September 16, 2026, its first increase since July 2023. On September 21, Chicago Fed President Austan Goolsbee called the Fed's response to persistent supply shocks "the painful trade-off between employment and inflation that stagflationary shocks always impose on a central bank," without saying the economy is in stagflation.
The case against:
- Core CPI, which leaves out food and energy, rose 2.6% in the 12 months through September 2026.
- Unemployment was 4.2% in September 2026, and real GDP grew at a 2.2% annual rate in the second quarter of 2026.
- The FOMC's September 16 statement said economic activity "is expanding at a solid pace," and on October 1, Fed Vice Chair Philip Jefferson said "the predominant factor driving the recent pickup in headline inflation is energy prices."
Two events will update the US picture: the FOMC meeting on October 27 to 28, 2026, and the advance estimate of third-quarter GDP on October 29.
How Does the Fed Fight Stagflation?
The Fed fights stagflation with difficulty, because its main tool, the interest rate, works against one of its two goals, stable prices or maximum employment, to help the other.
- Raise rates: Higher rates cool demand and bring inflation down, but they slow growth and can push unemployment up.
- Cut rates: Lower rates support borrowing, growth, and jobs, but they can keep inflation running hot.
Powell, then Fed Chair, described the bind on April 16, 2025: "We may find ourselves in the challenging scenario in which our dual-mandate goals are in tension." Volcker took the first path in 1979 and accepted a painful recession to break the decade's inflation. When people trust the Fed to bring inflation back down, expectations stay anchored and a price shock is easier to contain. Beyond its policy rate, the Fed can also lean on its balance sheet through quantitative easing and tightening. Higher rates also raise the interest cost of federal debt, one pressure behind the debate over a US debt crisis.
What Does Stagflation Mean for Bitcoin Miners?
Stagflation squeezes Bitcoin miners from the cost side, because they earn Bitcoin but pay for power and hardware in dollars. An energy shock raises the cost of power, and broad inflation can lift the dollar cost of machines, parts, and labor. On the revenue side, miners track hashprice, the expected daily revenue a miner earns per unit of hashrate. Hashprice moves with Bitcoin's price, network difficulty, transaction fees, and the block subsidy.
When dollar costs rise faster than hashprice, margins narrow. Miners can't set Bitcoin's price or the network difficulty, so the levers they control sit on the cost side: power, uptime, and when to run machines.
Bitcoin did not exist in the 1970s: its genesis block was mined on January 3, 2009. Its supply is fixed by design, with never more than 21 million coins and no central issuer, and new coins enter only through mining. A fixed supply is not a fixed price, and Bitcoin's dollar price can swing a long way in either direction.
FAQs About Stagflation
How long did the 1970s stagflation last?
The 1970s stagflation came in bouts rather than one long stretch, during the 1973 to 1975 and 1980 recessions. Both fell inside the Great Inflation, which Federal Reserve History dates from 1965 to 1982. Volcker's policies broke the cycle of stagflation by the end of 1982.
Has stagflation happened outside the US?
Yes, and the word itself comes from Britain, where Conservative MP Iain Macleod is credited with coining it in 1965. UK retail price inflation peaked at 26.9% in August 1975, while unemployment rose from 3.7% in 1973 to 5.6% in 1977. Britain had a name for the problem eight years before the first oil shock.
What is the difference between deflation and disinflation?
Deflation is a sustained decrease in the general price level, so goods and services get cheaper over time. Disinflation is a slowdown in the rate of inflation, so prices still rise, but at a slower pace. The US saw disinflation in the early 1980s, when 12-month CPI inflation fell from 14.8% in March 1980 to 3.8% by December 1982.
Can tariffs cause stagflation?
Tariffs can raise prices and slow growth at the same time, the two halves of stagflation. On April 16, 2025, Powell, then Fed Chair, said the economic effects of tariffs "will include higher inflation and slower growth," though he did not use the word stagflation. How far the effects go depends on how large the tariffs are and how long they last.
Mine Bitcoin Through Any Economic Cycle
Mining through any economic cycle comes down to the costs you control. Simple Mining offers ASIC hosting with Precision Billing: you own the hardware, pick your own pool, and receive rewards in a wallet you control. Simple Mining never takes custody of your Bitcoin. Precision Billing means you're billed only for the hours a machine is hashing, and the Pause Period lets you pause without losing your hosting slot or paying for paused time. Those are the cost controls that matter when power costs and hashprice move.
Hosted machines run at 95% average uptime. You can browse Bitcoin miners for sale or start with a 7-day free trial on an Antminer S21+ at 235 TH/s.