

US Debt Crisis 2026: Is $40 Trillion a Problem for the Dollar?
By Josh Heine, Content Strategist at Simple Mining
Updated September 24, 2026Published April 26, 2025
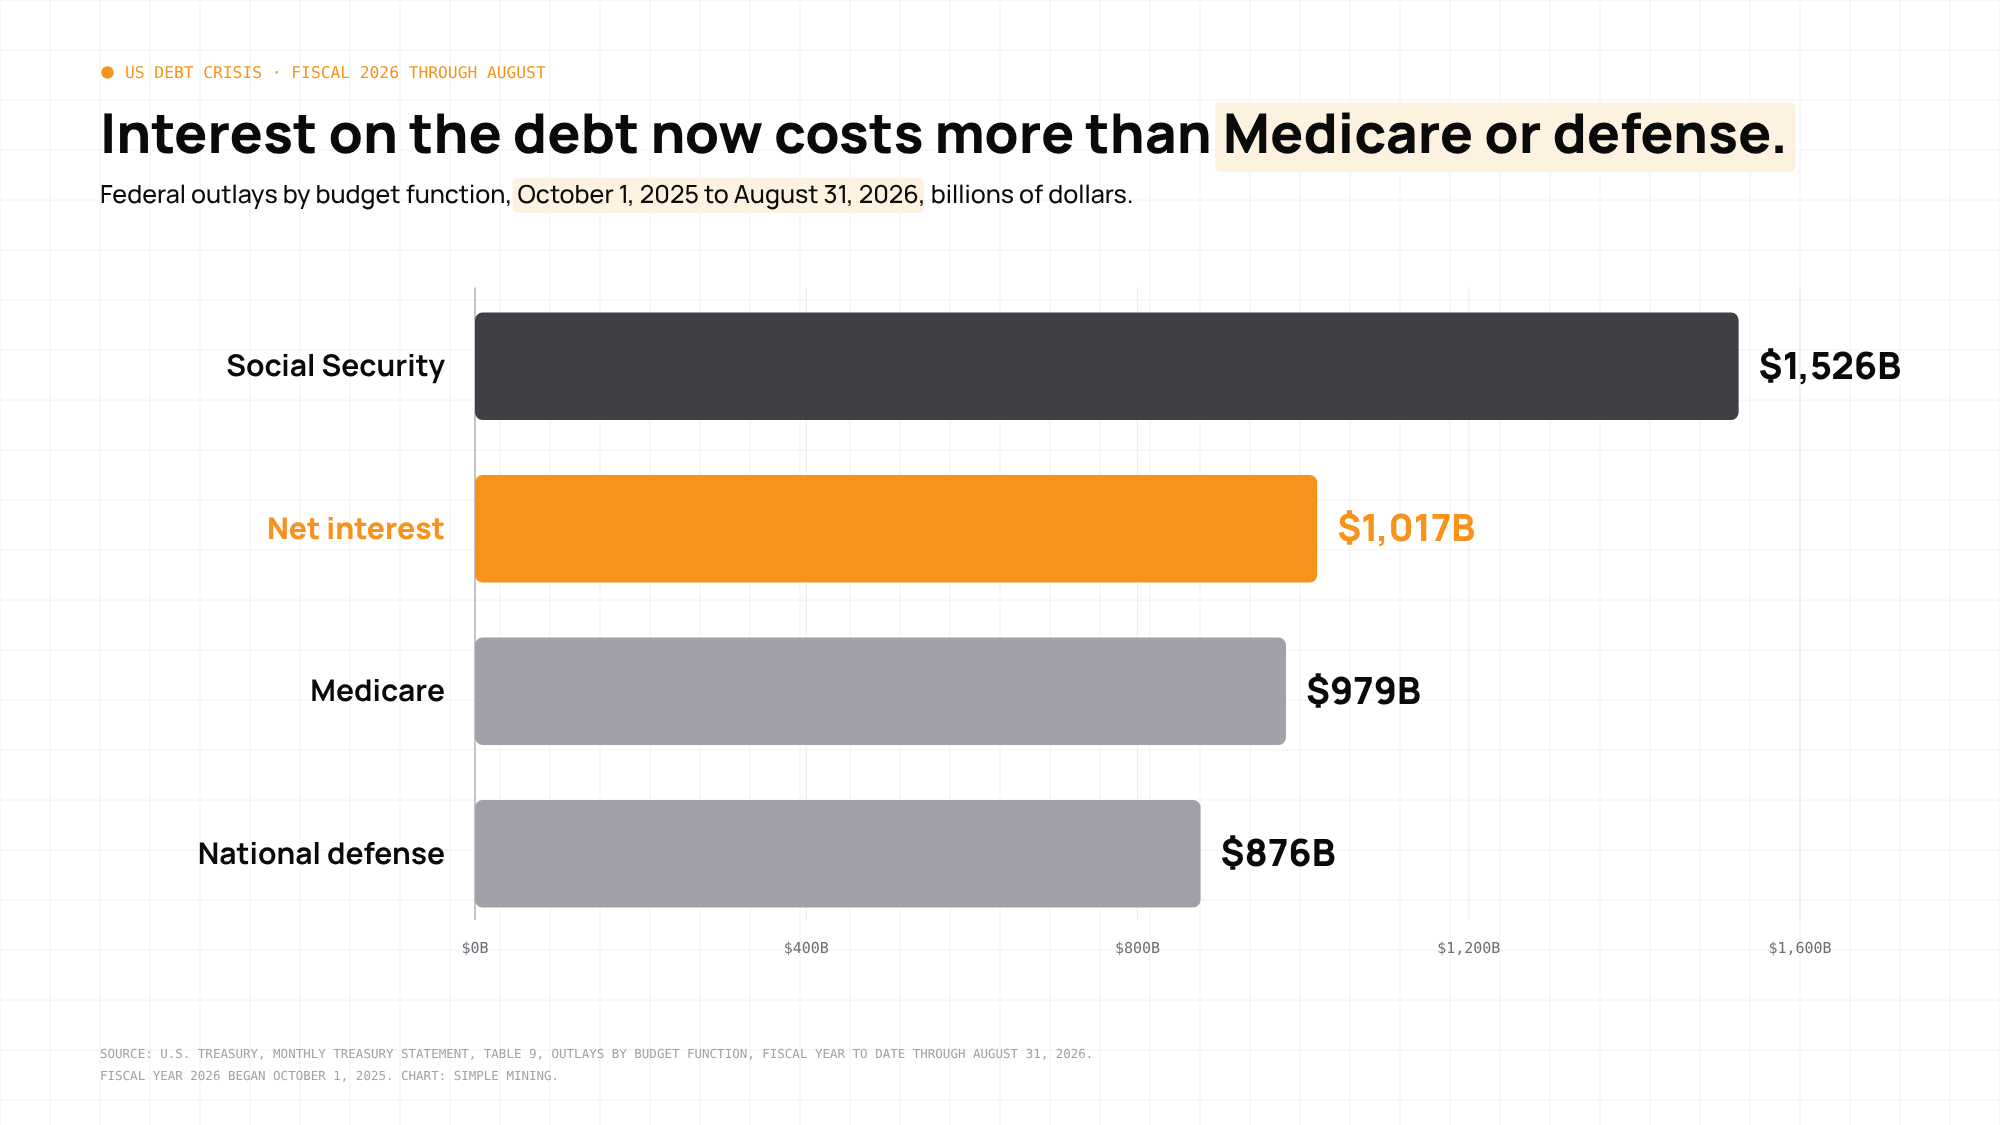
The US debt crisis is federal debt growing faster than the economy while interest grows faster than the revenue that pays it: gross debt was $40.1 trillion on September 22, 2026 and net interest for fiscal 2026 through August reached $1,017 billion, more than the government spent on Medicare or national defense.
So is the US debt a problem? The level alone is not the crisis. What changed is the price of borrowing, which has more than doubled in five years.
On this page · 14 sections
- What Is the US Debt Crisis?
- How Much Debt Does the US Have?
- Why Is the US in So Much Debt?
- What the Debt-to-GDP Ratio Shows
- Who Holds US Debt?
- Why Interest Payments Are Accelerating the Crisis
- What Happens If the Debt Crisis Gets Worse
- How the Debt Crisis Threatens the Dollar
- Is US Debt Sustainable?
- How the Debt Crisis Affects Everyday Americans
- Why Hard Assets Gain Appeal During Fiscal Uncertainty
- Where Bitcoin Mining Fits
- FAQs About the US Debt Crisis
- What the Next Debt Ceiling Fight Could Bring
Key Takeaways
- Gross US debt was $40,097.8 billion on September 22, 2026 and first topped $40 trillion on August 18, 2026.
- Net interest reached $1,017 billion in fiscal 2026 through August, more than Medicare or national defense and 21.0% of receipts.
- Debt held by the public is 99.7% of GDP against a 1946 record of 106%, and CBO projects 120% by 2036, above that record.
- No major rating agency rates the United States triple-A. The next debt ceiling fight is expected in mid-to-late 2027.
What Is the US Debt Crisis?
The US debt crisis is federal debt that grows faster than the economy while the interest on that debt grows faster than the revenue that pays it. Neither half is new: the federal government has run a deficit in all but four of the last 50 years. What turned the national debt crisis acute is rates.
The average interest rate on marketable Treasury debt was 1.458% on August 31, 2021 and 3.475% on August 31, 2026, according to Treasury's Average Interest Rates dataset.
How Much Debt Does the US Have?
Treasury's Debt to the Penny put gross US debt at $40,097.8 billion on September 22, 2026. That total splits into $32,375.7 billion held by the public and $7,722.1 billion in intragovernmental holdings. The debt first closed above $40 trillion on August 18, 2026 at $40,047,425,768,420.22. Ten years earlier the total was $19,524.8 billion on September 23, 2016, so the debt has about doubled in a decade.
Gross Debt vs. Debt Held by the Public
Gross debt is total public debt outstanding. Debt held by the public is the part owned outside the federal government: households, banks, funds, foreign holders, and the Federal Reserve. Intragovernmental holdings are the rest, in large part securities owned by trust funds such as Social Security. The $40 trillion headline is gross debt; the market watches debt held by the public, because that is the amount that must find a buyer at auction.
US Debt Compared to Other Countries
Among the seven large economies below, only Japan and Italy carry a higher general government gross debt ratio than the United States in the IMF's April 2026 projection for 2026. The countries with the highest national debt sit at the top of the table.
| Country | Debt to GDP, 2026 |
|---|---|
| Japan | 204.4% |
| Italy | 138.4% |
| United States | 125.8% |
| France | 118.4% |
| China | 106.9% |
| United Kingdom | 103.6% |
| Germany | 64.6% |
General government gross debt % of GDP. IMF World Economic Outlook, April 2026 projections for 2026.
The IMF projects the United States at 142.1% by 2031, the steepest rise in the group. Its general government measure differs from the US ratios used elsewhere in this article.
Why Is the US in So Much Debt?
Why is the US in so much debt? Because spending that is set by law grows on its own while revenue does not, and interest on past borrowing now widens the gap every year.
Mandatory Spending
Mandatory spending is outlays that current law requires without an annual vote: Social Security, Medicare, Medicaid, and smaller benefit programs. It totaled $4.2 trillion in fiscal 2025 according to CBO, about 60% of $7.0 trillion in total outlays.
Revenue That Trails Spending
Federal receipts were $5,235 billion in fiscal 2025 against outlays of $7,010 billion, a deficit of $1,775 billion. Fiscal 2026 through August shows receipts of $4,845 billion and a deficit of $1,966 billion per the Monthly Treasury Statement, already past the full fiscal 2025 total.
Interest on Existing Debt
Interest is the third driver. Every deficit is covered by new Treasury securities, and each carries a coupon that becomes next year's spending. The numbers are in the interest payments section below.
What the Debt-to-GDP Ratio Shows
US debt vs GDP measures the debt against a year of economic output, and its two versions tell different stories. Gross debt of $40.1 trillion against second quarter 2026 GDP of $32.486 trillion is 123.4%. Debt held by the public of $32.4 trillion against the same GDP is 99.7%. The $40 trillion headline pairs with the gross ratio.
Debt held by the public peaked at 106% of GDP in 1946 at the end of World War II. Today's 99.7% sits about 6 points below that record. CBO projects the ratio at 101% at the end of fiscal 2026 and 120% in 2036, above the 1946 high. The gross ratio does not compare to the 1946 record, because it counts debt the government owes its own trust funds.
BEA publishes its annual GDP revision on September 30, 2026, which will nudge both ratios.
Who Holds US Debt?
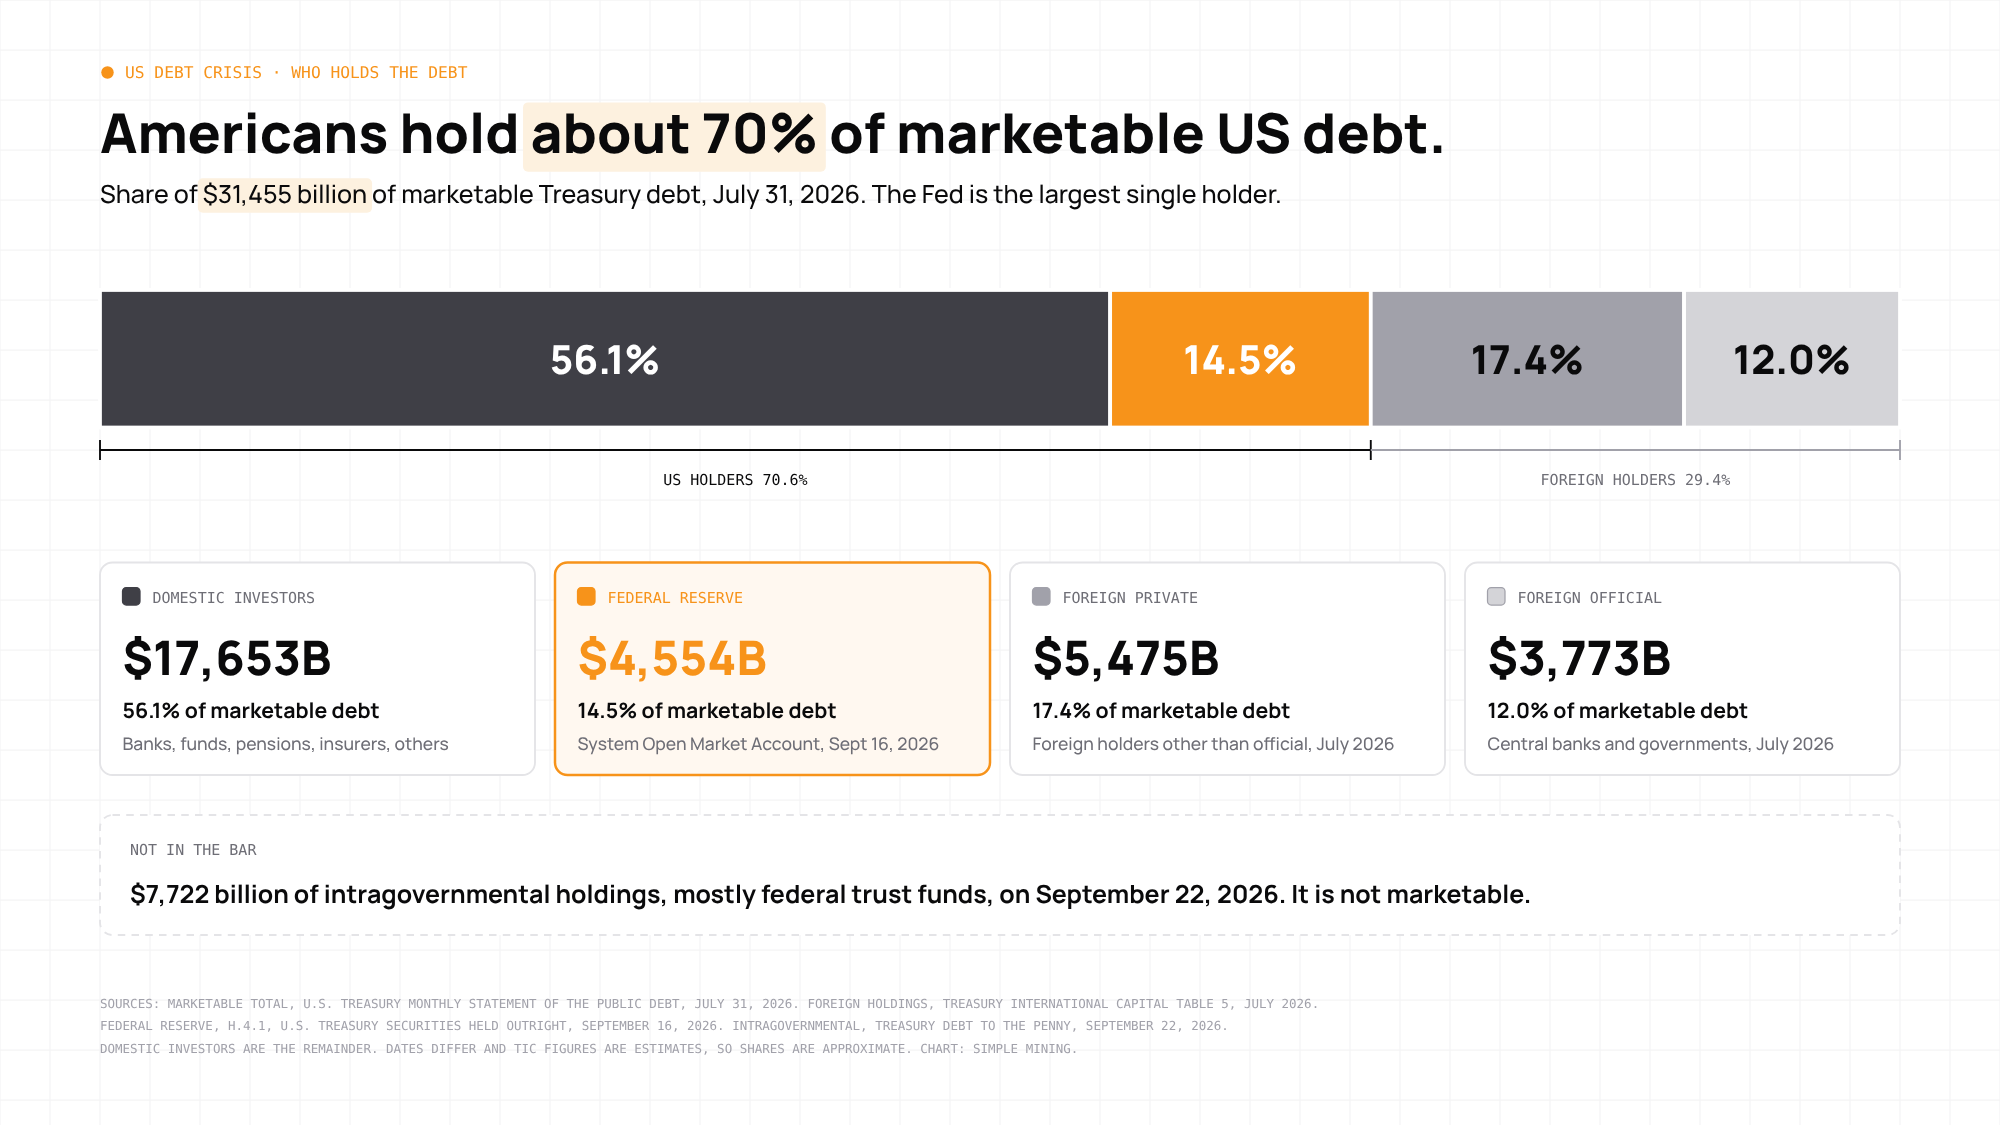
American holders own about 70% of marketable Treasury debt and foreign holders own the rest, so the answer to who holds the most US debt is the United States itself. The Federal Reserve is the largest single holder.
Domestic Investors and Institutions
Banks, money market funds, pension funds, insurers, and households hold about 56% of marketable Treasury debt.
Foreign Governments and Investors
Foreign holders owned $9,248 billion of Treasuries in July 2026, according to Treasury International Capital data. That is up $139 billion from July 2025 but down from a February 2026 peak of $9,487 billion. Foreign official holders such as central banks fell to $3,773 billion from $3,887 billion a year earlier. Japan held $1,104 billion, the United Kingdom $998 billion, and China $618 billion. China's figure is its lowest since 2008.
The foreign share of marketable debt was 29.4% in July 2026 against a peak near 34% in 2015. In dollars foreign demand is still rising; as a share of a fast growing debt it is falling.
The Federal Reserve
The Federal Reserve held $4,554 billion of Treasury securities on September 16, 2026. Most of those holdings came from quantitative easing, the Fed's purchases of Treasuries with new bank reserves, and the Fed stopped shrinking them on December 1, 2025. On December 12, 2025 it began reserve management purchases: Treasury bills only, sized to keep bank reserves ample. It is not QE. The New York Fed publishes the schedule of any such purchases each month.
The Fed's balance sheet remains tied to the Treasury market: it is the largest single holder, it rolls over its maturing Treasuries at auction, and its bill purchases absorb part of new issuance.
Why Interest Payments Are Accelerating the Crisis
Net interest on the debt reached $1,017 billion in fiscal 2026 through August. That exceeds Medicare at $979 billion and national defense at $876 billion and trails only Social Security at $1,526 billion in the Monthly Treasury Statement's outlays by function. Net interest consumed 21.0% of the $4,845 billion in receipts collected over the same eleven months.
Some commentators cite $1.3 trillion. That is gross interest on Treasury debt securities of $1,267 billion through August, which counts interest paid to the government's own trust funds.
The average interest rate on marketable debt was 3.475% on August 31, 2026 against 1.458% on August 31, 2021. About $9.2 trillion of marketable debt held by private investors was due to mature within a year on June 30, 2026. That is 34.6% of the $26.6 trillion they hold, roughly one-third.
The 10-year Treasury yielded 5.11% on September 23, 2026 against 3.70% on September 18, 2024 per the Treasury Daily Par Yield Curve, the day the Fed began cutting rates. The Fed has since reversed course and raised its policy rate to a range of 3.75% to 4.00% on September 16, 2026.
- Higher rates: each maturing security rolls over at today's higher yields.
- Crowding out: every dollar of interest is a dollar unavailable for anything else without a larger deficit.
- Debt spiral: the deficit covers the interest, the interest raises the debt, and the larger debt raises next year's interest.
What Happens If the Debt Crisis Gets Worse
A worsening debt crisis shows up first in the price of Treasury debt and then in the budget, and the United States has already seen downgrades, a brief technical default, and a shrinking budget for everything else.
Credit Rating Downgrades
No major rating agency rates the United States triple-A. S&P cut its rating to AA+ on August 5, 2011. Fitch followed to AA+ on August 1, 2023. Moody's moved to Aa1 from Aaa on May 16, 2025 and cited more than a decade of rising debt and interest ratios.
Default Risk
What happens if the US defaults on its debt is not a pure hypothetical. Treasury missed payments on bills maturing April 26, May 3, and May 10, 1979. It blamed a late debt ceiling vote, record demand from small investors, and a failure of the word processing equipment that prepared the payment schedules. The study of that episode found a 60 basis point rise in Treasury bill yields that did not reverse after the payments were made.
On August 8, 2011 the Dow fell 5.55% and the S&P 500 fell 6.66% on the first trading day after the S&P downgrade.
Less Room in the Budget
Interest is the first claim on revenue, so a rising interest bill shrinks the space for everything Congress votes on each year. As net interest grows toward CBO's projected $2.1 trillion in 2036, every other program competes for a smaller pool or adds to the deficit.
How the Debt Crisis Threatens the Dollar
The debt threatens the dollar through inflation and through confidence: inflation shrinks the real value of what the government owes, and a loss of confidence shrinks the world's appetite to hold dollars and Treasuries. The first is at work; the second has not shown up so far.
Inflation and the Real Value of the Debt
Inflation works in the government's favor because debt is fixed in nominal dollars, so when prices rise the same debt becomes a smaller share of a larger nominal economy. Current-dollar GDP grew 8.0% at an annual rate in the second quarter of 2026 while real GDP grew 1.5%, and that gap, which is inflation, enlarges the economy the debt is measured against without a dollar of repayment. Who pays for that is a different question, and the answer runs through the Cantillon effect.
Risk to Reserve Currency Status
The dollar's share of allocated global foreign exchange reserves was 57.13% in the first quarter of 2026 according to the IMF's COFER data, up from 56.42% in the fourth quarter of 2025. About half of that rise was valuation from a stronger dollar. The dollar index fell about 9.6% in 2025 to 98.28 on December 31, then rose about 3% in 2026 to 101.08 on September 24. Neither move reads as a run on the currency.
Supplying the dollars the world holds as reserves requires the United States to keep issuing debt, a tension that explains why the Triffin dilemma still binds.
Capital Flight Toward Other Assets
Two channels show investors moving part of their dollar holdings into Bitcoin. Bitcoin treasury companies hold Bitcoin on corporate balance sheets in place of cash. Investors who want the same exposure inside a brokerage account use spot Bitcoin ETFs.
Is US Debt Sustainable?
US debt is sustainable as long as buyers keep showing up at a price the budget can bear, and the debate is about how long that condition holds. Three camps frame it.
- Optimist view: reserve status and nominal growth can outrun the debt, as they did after 1946.
- Pessimist view: structural deficits and demographics make the path unsustainable at today's rates.
- Consensus: correction is needed; the argument is over timing and method.
Lyn Alden puts the timing in her June 2025 newsletter: think of the debt as a dial, not a switch. It already matters, but the dial has room to turn. Then-Chair Jerome Powell told CBS 60 Minutes on February 4, 2024 that "in the long run, the U.S. is on an unsustainable fiscal path." Sustainability comes down to growth relative to interest rates, the path of yields, and political choices about revenue and spending.
How the Debt Crisis Affects Everyday Americans
The debt reaches households through three channels: prices, borrowing rates, and the eventual mix of taxes and benefits. Two are visible in 2026 data.
Rising Cost of Living
The Consumer Price Index rose 3.4% over the 12 months to August 2026, per the BLS release of September 11, 2026. Energy prices rose 16.3% over the same period and drove much of the increase.
Higher Rates on Mortgages and Loans
The 30-year fixed mortgage averaged 6.95% in Freddie Mac's survey of September 17, 2026, up from 6.26% a year earlier and from a 2026 low of 6.01% on February 19. Mortgage rates track the 10-year Treasury yield plus a spread. When the 10-year rose from 3.97% on February 27, 2026 to 5.11% on September 23 home loans followed.
Higher Taxes or Reduced Benefits
A debt that is not inflated away or outgrown is paid through higher taxes, lower benefits, or both. Social Security and Medicare are the largest lines in the budget, so that is where the pressure lands first. Savers face a separate cost when a government that leans on inflation repays them in dollars that buy less.
Why Hard Assets Gain Appeal During Fiscal Uncertainty
This section describes what investors have done, not investment advice. Hard assets gain appeal during fiscal uncertainty because they carry no issuer's promise, so a downgrade or a debt ceiling fight does not change what they are.
Gold
Gold set a record of $5,589.38 an ounce on January 28, 2026 and traded near $4,254 on September 24, 2026, about 24% below that peak. Its run to the record coincided with the May 2025 Moody's downgrade, the July 2025 debt ceiling increase, and deficits near $2 trillion.
Real Estate
Property carries its own fiscal exposure, because mortgage rates follow Treasury yields and a debt that pushes the 10-year to 5.11% raises the cost of owning a home with it. Land and rents still hold real value when prices rise.
Bitcoin
Bitcoin's supply is capped at 21 million coins and new issuance falls by half at the Bitcoin halving about every four years. Set against a debt that grows about $2 trillion a year, that is the whole argument; whether Bitcoin is a good investment is a separate question this article does not settle.
The record so far is mixed. Bitcoin set a record of $126,210 on October 6, 2025 and traded near $84,000 on September 24, 2026, about 33% below it. It fell about 5% in calendar 2025 while gold rose more than 60%, and it is about 4% lower in 2026 through September 24. Over both periods it traded like a risk asset that falls when yields rise, not like a hedge.
Where Bitcoin Mining Fits
Mining earns Bitcoin at production cost rather than at the market price, which removes market timing but not price risk: revenue still moves with the Bitcoin price and network difficulty. The choice between mining vs buying Bitcoin comes down to time horizon. Buying delivers exposure today; mining delivers new coins over the life of the machine.
The cost to mine a Bitcoin depends on machine efficiency and the cost of power, and Bitcoin mining hosting is how individual investors place machines without running a facility. Simple Mining is headquartered in Cedar Falls, Iowa and operates 11 sites in Iowa with 150+ MW of capacity and 9+ EH/s at 95% average uptime. Hosting is a bundled hosting service fee of $0.065 to $0.08 per kWh.
FAQs About the US Debt Crisis
What is the difference between the federal deficit and the national debt?
The deficit is one year's gap between spending and revenue; the debt is the sum of every past deficit less every surplus plus what the government owes its own trust funds. The fiscal 2025 deficit was $1,775 billion and gross debt was $40.1 trillion on September 22, 2026.
Is it possible for the US to get out of debt?
How can the US get out of debt? Four ways, and none is quick: grow the economy faster than the debt, run surpluses, let inflation shrink the real value, or change spending and taxes. The last surplus was fiscal 2001 at $128.2 billion, one of four in the last 50 years.
Can Bitcoin serve as a hedge against dollar devaluation?
The case rests on a fixed supply set against a debt that grows about $2 trillion a year, but the record so far does not confirm it. Bitcoin fell about 5% in 2025 while gold rose more than 60%, and it is about 4% lower in 2026 through September 24. The Bitcoin vs gold comparison covers the two in past stress periods.
What are warning signs that the US debt crisis is getting worse?
Four indicators with their latest readings: the 10-year Treasury yield at 5.11% on September 23, 2026; net interest at 21.0% of receipts in fiscal 2026 through August; ratings of AA+ from S&P and Fitch and Aa1 from Moody's; and the foreign share of marketable debt at 29.4% in July 2026 and falling.
What the Next Debt Ceiling Fight Could Bring
The US debt ceiling stands at $41.1 trillion after the $5 trillion increase enacted on July 4, 2025, and gross debt of $40.1 trillion on September 22, 2026 leaves about $1 trillion of headroom. The Committee for a Responsible Federal Budget expects the next binding episode in mid-to-late 2027, so it is not imminent. Congress has modified the limit more than 100 times since World War II by the Congressional Research Service's count.
Investors curious about mining can look at the Bitcoin miners for sale and take a 7-day free trial on an Antminer S21+ at 235 TH/s. Nothing in this article is a recommendation to buy or sell anything.