

What Is mNAV? MSTR's Premium to Bitcoin NAV Explained
By Josh Heine, Content Strategist at Simple Mining
Updated September 9, 2026Published August 3, 2026
mNAV stands for multiple of net asset value, the ratio the market uses to price Bitcoin treasury companies like Strategy (MSTR). Divide a company's enterprise value by the market value of its Bitcoin and you get the multiple. For most of the past four years Strategy traded above 1.0x, at times far above it. The equity premium is gone: basic mNAV reads 0.81x as of September 8, 2026, while the enterprise measure sits at 1.09x, back above the line it crossed below in late June. This guide explains the metric, the variants that confuse every tracker comparison, and why the premium collapsed.
On this page · 12 sections
- What Is mNAV
- What Is Bitcoin NAV
- How to Calculate mNAV
- What Is MicroStrategy's mNAV
- What a High or Low mNAV Means
- Why Strategy's mNAV Premium Collapsed
- What mNAV Does Not Tell You
- How mNAV Changes What You Pay Per Bitcoin
- How to Track mNAV
- mNAV by Ticker: BMNR, SBET, XXI, ASST, and the Rest of the Sector
- FAQs About mNAV
- Owning the Ratio or Owning the Machines
Key Takeaways
- mNAV stands for multiple of net asset value: enterprise value divided by the market value of a company's Bitcoin.
- A reading above 1.0 is a premium to the Bitcoin and a reading below 1.0 is a discount.
- Strategy's basic mNAV reads 0.81x as of September 8, 2026, down from a peak near 3.4x in November 2024.
- Basic, diluted, and enterprise variants can land on opposite sides of 1.0 on the same day, so every reading needs a variant name and a date.
- Above 1.0x a treasury company can issue stock and grow Bitcoin per share; below 1.0x the same issuance dilutes it.
What Is mNAV
mNAV stands for multiple of net asset value. It is a ratio, not a dollar figure: it tells you how many times the market is paying for each dollar of Bitcoin a treasury company holds. A reading of 1.5x means the market prices the enterprise at 150 percent of its Bitcoin stake. A reading of 0.8x means it prices the enterprise below the coins themselves.
The metric exists because a Bitcoin treasury company is two things at once: an operating business and a stack of coins. Earnings multiples say little about the stack, so investors built a balance sheet ratio instead. Strategy's own dashboard notes define mNAV as a market-derived ratio expressed as a multiple, and warn that despite the label it is not equivalent to net asset value in the traditional financial sense. The name suggests a NAV variant. The math is a multiple.
What Is Bitcoin NAV
Bitcoin NAV is the market value of the Bitcoin a company holds: the coins on the balance sheet multiplied by the current Bitcoin price. It is the denominator of the mNAV ratio. When Bitcoin moves the NAV moves with it, tick by tick.
Market Cap vs Bitcoin Holdings
Market cap and Bitcoin holdings measure different things, and the gap between them is the whole point of mNAV.
- Market cap: the value of all outstanding shares at the current stock price. It prices the equity claim on everything the company owns and owes.
- Bitcoin holdings: the coins on the balance sheet at the live Bitcoin price. This is an asset value with no claim structure attached.
A stock can rise while the coins fall. The coins can rise while the stock falls. mNAV captures that divergence in one number.
Why NAV Matters for Bitcoin Treasury Companies
NAV gives investors a live baseline for a company whose main asset trades around the clock. Financial statements arrive once a quarter and Bitcoin reprices every second, so a filed balance sheet is stale on arrival. Marking the coins to market closes that gap. It also makes companies comparable: every treasury balance collapses to one dollar figure at the same spot price.
How to Calculate mNAV
Divide the company's enterprise value by the market value of its Bitcoin. Both inputs are public and the whole calculation takes a minute.
The mNAV Formula
mNAV = Enterprise Value ÷ Bitcoin NAV
Enterprise Value = market cap + total debt + preferred equity - cash
Bitcoin NAV = BTC held × current BTC price
Enterprise value leads for a reason. Debt and preferred stock sit above common shareholders in the capital structure, so market cap alone understates what the whole enterprise costs. BitcoinTreasuries.net made the enterprise version its default calculation on the same logic.
Basic, Diluted, and Enterprise mNAV
Three variants of mNAV circulate and they disagree by design.
- Basic mNAV uses market cap alone as the numerator.
- Diluted mNAV adds shares from options, restricted stock, and in-the-money convertibles.
- Enterprise mNAV uses full enterprise value: market cap plus debt plus preferred equity minus cash.
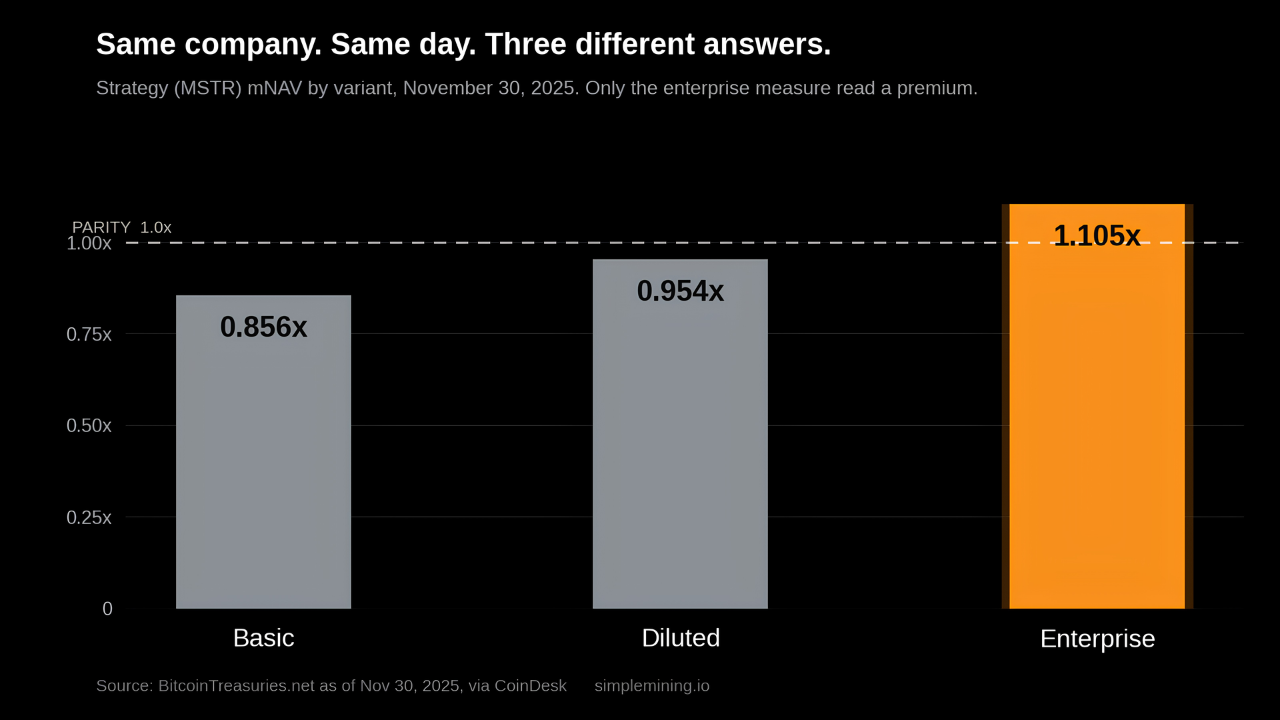
The divergence is not academic. On November 30, 2025 Strategy printed a basic reading of 0.856, a diluted reading of 0.954, and an enterprise reading of 1.105 at the same moment. Equity holders saw a discount while the full capital structure still carried a premium. Same company, same day, opposite sides of 1.0.
There is a fourth number to watch for. Effective July 23, 2026 Strategy redefined the mNAV on its own dashboard as share price divided by net Bitcoin per share, and the company states that figures before and after that date are not comparable. Its redefined figure printed near 1.04x in late July 2026 while basic readings from third-party trackers sat near 0.68x. Neither number is wrong. They measure different things, so never blend the dashboard figure with a tracker figure.
A Worked Example
Take a company with a $40 billion enterprise value holding $50 billion of Bitcoin at spot. mNAV = $40B ÷ $50B = 0.8x. The market prices the whole enterprise at 80 cents per dollar of Bitcoin, a 20 percent discount. Flip the inputs and a $50 billion enterprise value on $40 billion of Bitcoin gives 1.25x, a 25 percent premium. No date required: the arithmetic works at any Bitcoin price.
What Is MicroStrategy's mNAV
Strategy trades at a basic mNAV of 0.81x as of September 8, 2026, a discount of about a fifth to the market value of its own Bitcoin. The company retired the MicroStrategy name: the rebrand from MicroStrategy to Strategy arrived on February 5, 2025 and the legal name became Strategy Inc on August 11, 2025. The MSTR ticker never changed. The enterprise measure adds debt and preferred stock on top of market cap and read 1.09x on the same date, back above the line it crossed below in late June. The gap between those two readings is the point: the whole capital structure prices at a modest premium to the Bitcoin, while the common equity alone trades about a fifth below it.
The company holds 845,050 BTC as of August 30, 2026 at an average cost near $75,412 per coin, per its August 31 filing. The count was unchanged through September 6. The stake was worth $66.5 billion on September 8 against a $63.73 billion cost basis, so the largest corporate Bitcoin position on earth sits above its average cost again after a summer underwater. Strategy sold four times in 2026: 32 BTC at the start of June, 3,588 BTC for about $216 million in early July at a $203 million loss, 1,638 BTC for about $105 million in the week ended August 2, and 1,690 BTC for about $109 million in the week ended August 9, with proceeds funding preferred dividends and STRC buybacks. Then it bought again: 4,603 BTC for $369.7 million at an average of $80,318 in the week ended August 30, its first purchase since June 22. The sales were tactical rather than a reversal: four sales against 114 purchases since August 2020, and holdings are up 172,553 BTC on the year.
The arc matters more than any single reading. The basic multiple peaked near 3.4x in November 2024 alongside the share price all-time high. The prior floor was near 0.7x in May 2022. The August 3, 2026 basic reading of 0.68x sat at or below that 2022 trough, and the September 8, 2026 reading of 0.81x has climbed back above it. The strictest measure crossed last: enterprise mNAV fell below 1.0x around June 27, 2026, hovered near the line through August, and read 1.09x on September 8.
What a High or Low mNAV Means
A reading above 1.0 means the market values the enterprise above the market value of its Bitcoin, and a reading below 1.0 means beneath it. That much is arithmetic. Everything layered on top of it is interpretation, and the two deserve different levels of trust.
What a High mNAV Suggests
Above 1.0x the market pays more than a dollar for each dollar of Bitcoin. One consequence is mechanical and comes from Strategy's own disclosures: when mNAV sits above 1, issuing shares to buy Bitcoin increases Bitcoin per share. The premium funds the growth.
The rest is read as sentiment: confidence in management's capital execution, expectations of future accumulation, or a payment for levered exposure. Treat those readings as market hypotheses rather than properties of the number. The 2025 to 2026 compression came with the same company, the same management, and the same playbook, and the premium still evaporated.
What a Low mNAV Suggests
Below 1.0x the market pays less than a dollar per dollar of Bitcoin. The mechanical consequence inverts: issuing shares to buy coins now dilutes Bitcoin per share, which stalls the model. Common readings include doubt about leverage, doubt about dilution pace, or a risk-off market repricing every treasury stock at once. The ratio cannot tell you which one applies.
Miners live with a version of this ratio every day. A mining operation compares its production cost per Bitcoin against spot, and the question is the same one mNAV asks: what a dollar of Bitcoin exposure costs to acquire. When either ratio moves against you the response is discipline, not narrative.
What Is Considered a Good NAV Value
There is no universal good value, and the question mixes two terms worth separating. NAV is a dollar amount: the market value of the assets themselves. mNAV is the multiple the market pays for that amount. A high multiple holds up when the accretion loop keeps working and fails when it does not, and a discount can reflect real risk or real mispricing. Which one applies depends on facts the ratio cannot see, covered below.
Why Strategy's mNAV Premium Collapsed
Strategy's premium collapsed because the three forces that built it reversed: scarcity ended, the flywheel stalled, and senior claims grew. The basic multiple fell from about 3.4x in November 2024 to 0.68x on August 3, 2026 before recovering to 0.81x by September 8, 2026. Each leg deserves its own explanation.
Bitcoin Equity Scarcity Ended
For years MSTR was one of the only liquid ways to hold Bitcoin exposure in a brokerage account, and the market paid up for that access. Spot Bitcoin ETFs ended the scarcity in January 2024. By mid-2026 the field is crowded: about 200 public companies hold Bitcoin as a treasury asset and the ETFs absorb the pure access demand. Scarcity built the old premium, and its erosion helped unwind it.
The Flywheel Requires a Premium
The accretion loop only runs above 1.0x. Sell stock above the value of the coins and buy Bitcoin with the proceeds, and each remaining share ends up backed by more Bitcoin. That is how the Bitcoin treasury company model works, and Strategy ran it at scale for years.
Below 1.0x the same trade runs backward and dilutes Bitcoin per share. Strategy's 2026 moves show it knows the math. The $1.0 billion common stock repurchase program authorized in June was still unused as of August 30. The company had used about $635 million of a $1.0 billion STRC buyback authorization by August 30, bought another $176.3 million of STRC in the week ended September 6, and doubled that authorization to $2 billion. The BTC Monetization Program sold $218.4 million of Bitcoin through late July, $105 million in the week ended August 2, and $109 million in the week ended August 9.
The exception cuts the other way. In the week ended August 30 Strategy sold $602.8 million of common stock while basic mNAV sat below 1.0x and put $369.7 million of it into 4,603 BTC at $80,318 a coin. On the basic measure that issuance dilutes Bitcoin per share. The company calls it selling MSTR at a premium to buy Bitcoin, a description that holds on its enterprise and redefined per-share measures but not on the basic one.
Debt and Preferred Claims Grew
Enterprise mNAV counts every claim senior to common stock, and those claims grew. Strategy carried $6.7 billion of convertible debt at the Q2 2026 close, after an 18 percent reduction during the quarter, alongside $15.4 billion of perpetual preferred stock across four listed series: STRK, STRF, STRD, and STRC. Both balances are Q2 figures and neither has been restated since, so they sit two months behind the September 8 readings above. The STRC buybacks retire preferred stock, so the current preferred balance is lower than $15.4 billion by an amount no filing has yet totalled. The four series are current. Of the $17.06 billion raised through ATM programs in 2026 through late July, 44 percent came through those preferred instruments rather than common equity.
The preferreds cost money to hold in place: $1.06 billion of dividends paid through late July, with the dollar reserve at $5.10 billion as of August 30, 2026 alongside $1.61 billion of other dollar cash. The company puts its USD duration, the period those reserves cover dividend and interest obligations, at 4.0 years. Every senior dollar raises enterprise value without adding a share. That pushes the enterprise multiple up relative to the basic one and leaves the equity less room beneath it.
What mNAV Does Not Tell You
mNAV prices the Bitcoin exposure and says nothing about the structure that delivers it. Four blind spots do the most damage.
Compression math. A premium can vanish faster than Bitcoin falls. In a drawdown the stock loses the asset move and the multiple at the same time, which is why treasury stocks fall harder than the coin they hold.
Claim seniority. Debt and preferred holders get paid before common shareholders. The ratio nets those claims into one number and hides their maturities, coupons, and covenants.
Dilution pace. A company can grow its total Bitcoin while shrinking each share's claim on it. Bitcoin per share tracks that; mNAV does not.
Variant drift. Two trackers can print numbers on opposite sides of 1.0 for the same company on the same day. A reading without a variant name and a date is noise.
None of this rates the stock. It defines what the number can and cannot carry, and the rest of the work sits in the filings.
How mNAV Changes What You Pay Per Bitcoin
At an mNAV of 1.5 a dollar of stock buys about 67 cents of Bitcoin. At 1.0 it buys a full dollar of Bitcoin, and at 0.90 it buys about $1.11. The multiple is a price tag on the exposure itself.
| mNAV | Bitcoin acquired per $1 of stock |
|---|---|
| 0.90x | about $1.11 |
| 1.00x | $1.00 |
| 1.50x | about $0.67 |
The table is the whole trade-off in three rows. What it hides is why the discount or premium exists: when the convertible notes mature, how fast the share count grows, and whether the operating business covers its own expenses. Those questions belong to the five-measure framework our treasury company guide walks through, and the answers change company by company.
How to Track mNAV
Third-party dashboards such as BitcoinTreasuries.net, mnav.com, and BitcoinQuant.co publish live mNAV readings for every major treasury company. The habit that matters is reading the variant label before the number. If you want MSTR mNAV today or the current MSTR mNAV, check whether the tracker shows a basic, diluted, or enterprise figure before comparing it to anything. MSTR mNAV history charts carry the same trap across time, since a series built on market cap will sit below one built on enterprise value.
Strategy's own dashboard uses the per-share formula redefined on July 23, 2026, so it will not reconcile with any enterprise tracker.
The metric now spans the whole sector, and the discount is not Strategy's alone. BitcoinTreasuries.net reads Metaplanet at 0.83x on an enterprise basis as of September 8, 2026, while its market cap against the same Bitcoin stack on the same page works out to 0.61x. Two variants, one company, one screen, a 0.22x spread. The Ethereum treasuries run identical math with ether in the denominator: SharpLink (SBET) prices at 0.82x basic and BitMine (BMNR) at 1.01x enterprise as of September 8, 2026, both on BitcoinTreasuries.net. A BMNR mNAV tracker reads the same as an MSTR one.
Alongside the ratio itself, watch Bitcoin per share, total debt and preferred outstanding, and the spot Bitcoin price. Those inputs explain most mNAV moves before a headline does.
mNAV by Ticker: BMNR, SBET, XXI, ASST, and the Rest of the Sector
Every treasury stock carries an mNAV, and as of September 8, 2026 most of the sector trades below 1.0x on the enterprise measure. The table lists the tickers investors search for most, with the holdings behind each ratio and the variant behind each reading. Every figure is from BitcoinTreasuries.net on September 8, 2026, either read from the page or computed from its displayed inputs as noted below. This table is the readings only; for what each company actually does with the coins, our guide to Bitcoin treasury companies profiles the largest holders one by one.
| Ticker | Company | Holdings | mNAV (variant) |
|---|---|---|---|
| MSTR | Strategy | 845,050 BTC | 0.81x basic, 1.09x enterprise |
| XXI | Twenty One Capital | 43,514 BTC | 0.71x enterprise |
| 3350 (TSE) / MTPLF | Metaplanet | 43,000 BTC | 0.61x basic, 0.83x enterprise |
| MARA | MARA Holdings | 35,577 BTC | Not published (miner); about 1.5x on market cap alone |
| ASST | Strive | 24,531 BTC | 1.46x enterprise |
| NAKA | Nakamoto | 4,467 BTC | 0.91x enterprise |
| SWC | The Smarter Web Company | 2,747 BTC | 0.73x enterprise |
| BMNR | BitMine Immersion | 5,929,198 ETH | 1.01x enterprise |
| SBET | SharpLink | 890,376 ETH | 0.82x basic |
| DFDV | DeFi Development | 2,294,576 SOL | 0.78x basic |
Three things in the table need saying out loud. The enterprise figures are the BitcoinTreasuries.net leaderboard default and add each company's debt and preferred stock to its market cap. The basic figures for Metaplanet, MARA, SBET, and DFDV are that same page's market cap divided by the market value of its holdings, since the site publishes an enterprise reading only for its Bitcoin leaderboard. Where a company shows two readings the spread is the variant lesson from earlier in this article playing out on a second and third balance sheet.
MARA is where the ratio stops working. Its market cap alone runs about 1.5x the market value of its 35,577 BTC as of September 8, 2026. Adding its debt pushes the enterprise figure higher, but most of that value is mining infrastructure rather than a premium on coins. mNAV assumes the digital asset is the dominant asset. A self-mining company breaks that assumption, which is why BitcoinTreasuries.net leaves the mNAV column blank for MARA and why a reading above 1.0x there means something different from the same reading at Strategy.
Strive (ASST) is the outlier on the other side. At 1.46x enterprise it carries the widest premium in the table and it is buying: 1,800 BTC in the week of August 31 and 1,375 more on September 8, with 70 percent of the September purchase funded by its SATA preferred stock. That is the accretion loop from earlier in this article running as designed, and the same math will run in reverse if the multiple crosses below 1.0x.
If you arrived here from a BMNR mNAV tracker or a search for SBET mNAV, the reading on any dashboard carries the same two questions as MSTR's: which numerator, and what date. Read the variant label, then the number.
FAQs About mNAV
What does mNAV stand for?
mNAV stands for multiple of net asset value. It is the ratio of a company's enterprise value to the market value of the Bitcoin it holds.
What is mNAV for MSTR?
Strategy (MSTR) trades at a basic mNAV of 0.81x as of September 8, 2026, up from 0.68x on August 3 and back above its prior floor near 0.7x from May 2022. The enterprise measure reads 1.09x on the same date after crossing below 1.0x in late June.
Is MSTR trading below mNAV?
On the equity measures, yes. Basic mNAV reads 0.81x and diluted 0.82x on September 8, 2026, while the enterprise measure reads 1.09x after crossing below 1.0x in late June.
What is MSTR premium to NAV?
MSTR carries no equity premium to NAV as of September 8, 2026. Basic mNAV reads 0.81x and enterprise mNAV reads 1.09x, against a peak near 3.4x in November 2024.
Can mNAV go below 1.0x?
Yes, and for Strategy it is not hypothetical. The basic multiple fell to about 0.7x in May 2022 and sits at 0.81x as of September 8, 2026, while the enterprise measure crossed below 1.0x in late June 2026 before recovering to 1.09x.
Why do two mNAV trackers show different numbers for the same company?
Because they use different numerators. Basic mNAV uses market cap, diluted mNAV adds convertible shares, enterprise mNAV adds debt and preferred stock, and Strategy's own dashboard uses a per-share formula redefined on July 23, 2026. Match the variant before comparing readings.
Owning the Ratio or Owning the Machines
mNAV prices someone else's Bitcoin strategy. Owning miners prices your own: hardware you hold, hashrate you control, and Bitcoin produced at your cost basis instead of a market multiple. Investors who want that direct exposure without the operational load use Bitcoin miner hosting in Iowa, where machines run on a bundled service fee of $0.07 to $0.08 per kWh. Run your numbers in our Bitcoin mining calculator, and when you are ready to test the model there is a 7-day free trial on S21-class hardware.