

September 2026 Bitcoin Market Report: Price, ETF Flows and Mining
By Josh Heine, Content Strategist at Simple Mining
Published October 2, 2026
Bitcoin closed September 2026 at $83,556.14 on Coinbase, up 6.36% from the September 1 open of $78,562.74. The month ran a 16.7% range between a $74,887.50 low on September 15 and an $87,397.00 high on September 21. Spot Bitcoin ETFs took in a net $2.65 billion, the Fed raised rates for the first time since 2023, and hashprice averaged 13.4% more than in August. This report covers what moved and what the month paid hosted miners, not what comes next.
On this page · 9 sections
- Bitcoin's Price in September 2026
- Is September Usually a Bad Month for Bitcoin?
- Spot Bitcoin ETF Flows in September 2026
- What Moved the Market in September 2026
- Bitcoin Hashrate and Difficulty in September 2026
- Was Bitcoin Mining Profitable in September 2026?
- What to Watch in October 2026
- FAQs About Bitcoin in September 2026
- Run September's Numbers on Your Own Machine
Key Takeaways
- Bitcoin closed September 2026 at $83,556.14 and gained 6.36% for the month after rising 25.05% in August.
- Spot Bitcoin ETFs netted $2.65 billion of inflows across 21 trading days, with IBIT taking in $1,807.8 million of it.
- The FOMC raised the federal funds target range to 3.75% to 4.00% on September 16 in its first hike since 2023.
- Network difficulty rose 5.52% over two adjustments and the hashrate estimate averaged about 944 EH/s.
- Hashprice averaged $39.38 per PH/s per day and margins widened on every machine across our all-in hosting rates of $0.065 to $0.08 per kWh.
Bitcoin's Price in September 2026
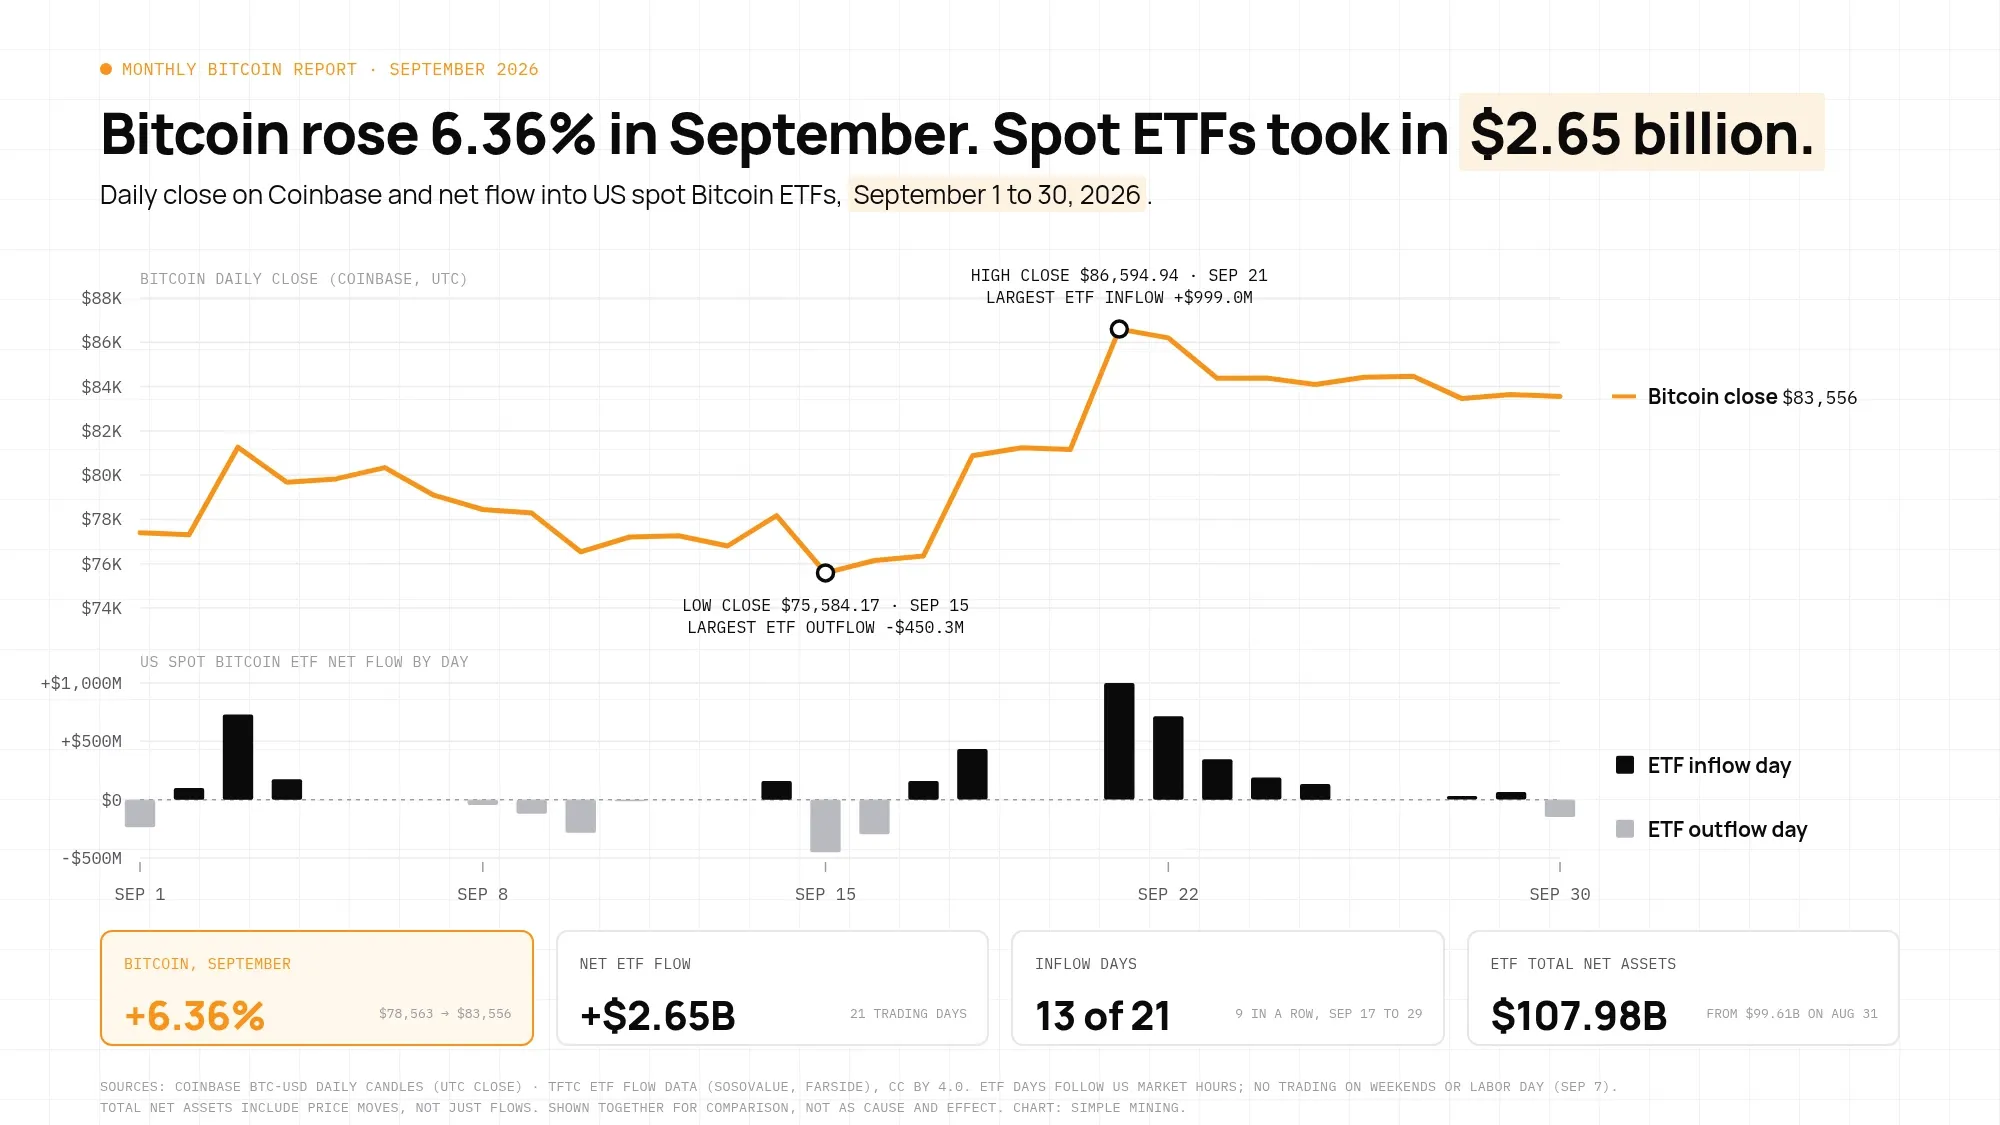
Bitcoin opened September 2026 at $78,562.74 and closed at $83,556.14 on Coinbase, a gain of 6.36%. The average close for the month was $80,471.61 against $69,487.39 in August. The high was $87,397.00 on September 21 and the low was $74,887.50 on September 15, a high-to-low range of 16.7%. August had delivered 25.05% from $62,826.69 to $78,562.74, so September added to a strong run rather than starting one.
| Week | Open | High | Low | Close | Change |
|---|---|---|---|---|---|
| Sep 1 to 7 | $78,562.74 | $82,283.00 | $76,219.18 | $79,091.97 | +0.67% |
| Sep 8 to 14 | $79,091.97 | $79,852.22 | $76,030.00 | $78,175.01 | -1.16% |
| Sep 15 to 21 | $78,175.00 | $87,397.00 | $74,887.50 | $86,594.94 | +10.77% |
| Sep 22 to 30 | $86,594.94 | $87,282.81 | $82,510.37 | $83,556.14 | -3.51% |
Early September Traded in a Narrow Range
Bitcoin spent the first two weeks of September between $76,030.00 and $82,283.00. The first week closed at $79,091.97 for a gain of 0.67%. The second week gave back 1.16% and closed at $78,175.01.
The Mid-Month Low and the September 21 Rally
The month's low of $74,887.50 printed on September 15, the same day Bitcoin fell 3.31% and spot ETFs posted their largest outflow of the month at $450.3 million. Three days later Bitcoin rose 5.93% to close at $80,875.04. On September 21 it rose 6.70% to close at $86,594.94 and touched the month's high of $87,397.00. That was also the day ETFs took in $999.0 million.
Late September Held Above $82,500
Bitcoin's low from September 22 to 30 was $82,510.37. The week opened at $86,594.94 and closed at $83,556.14 for a drop of 3.51%. ETFs took in $1,335.4 million over the seven trading days of the same stretch, the largest of the four weeks.
Is September Usually a Bad Month for Bitcoin?
September has closed lower in 6 of the 11 years from 2015 to 2025 on Coinbase, so the month's reputation holds for about half its history. September 2026's 6.36% gain was the best September since 2024's 7.35%. It is also the fourth green September in a row after 2023, 2024, and 2025.
| Year | Open | Close | Change |
|---|---|---|---|
| 2015 | $230.76 | $237.14 | +2.76% |
| 2016 | $572.89 | $608.99 | +6.30% |
| 2017 | $4,743.94 | $4,339.00 | -8.54% |
| 2018 | $7,015.01 | $6,605.00 | -5.84% |
| 2019 | $9,600.86 | $8,304.96 | -13.50% |
| 2020 | $11,655.00 | $10,779.63 | -7.51% |
| 2021 | $47,110.33 | $43,824.43 | -6.97% |
| 2022 | $20,048.27 | $19,426.11 | -3.10% |
| 2023 | $25,931.51 | $26,961.00 | +3.97% |
| 2024 | $58,968.37 | $63,301.25 | +7.35% |
| 2025 | $108,247.95 | $114,067.71 | +5.38% |
| 2026 | $78,562.74 | $83,556.14 | +6.36% |
Spot Bitcoin ETF Flows in September 2026
Spot Bitcoin ETFs took in a net $2.65 billion in September 2026 across 21 trading days, with 13 inflow days and 8 outflow days. August brought $3.52 billion. Inflows ran nine straight trading days from September 17 to September 29 before a $148.7 million outflow on September 30. The largest inflow day was September 21 at $999.0 million and the largest outflow day was September 15 at $450.3 million. Total net assets grew from $99.61 billion on August 31 to $107.98 billion as of September 30, 2026, a figure that includes price moves and not just flows.
BlackRock's IBIT led the month by fund and Grayscale's GBTC posted the largest outflow. You can follow the day-by-day Bitcoin ETF flows by fund on our tracker, built on TFTC ETF flow data from SoSoValue and Farside.
| Fund | September net flow |
|---|---|
| IBIT (BlackRock) | +$1,807.8M |
| FBTC (Fidelity) | +$682.5M |
| MSBT (Morgan Stanley Bitcoin Trust) | +$251.1M |
| BTC (Grayscale Bitcoin Mini Trust) | +$97.5M |
| ARKB | +$89.6M |
| HODL | -$35.5M |
| GBTC | -$259.3M |
| Week | Trading days | Net ETF flow | Price change |
|---|---|---|---|
| Sep 1 to 7 | 4 (Labor Day closed Sep 7) | +$770.2M | +0.67% |
| Sep 8 to 14 | 5 | -$302.7M | -1.16% |
| Sep 15 to 21 | 5 | +$845.1M | +10.77% |
| Sep 22 to 30 | 7 | +$1,335.4M | -3.51% |
What Moved the Market in September 2026
Six dated events shaped the September 2026 news flow: a Fed rate hike, an August CPI report, a failed Senate vote on the CLARITY Act, a pause and restart in Strategy's buying, a Bitget hot wallet breach, and a $2.276 billion debt raise at CleanSpark. Each is dated below. None is offered as the reason Bitcoin moved.
September 16: The Fed raised rates. The FOMC raised the federal funds target range by 25 basis points to 3.75% to 4.00% on September 16 by a 12 to 0 vote, per the Fed's statement. It was the Fed's first rate increase since 2023. The range had held at 3.50% to 3.75% at every 2026 meeting before September. Five days earlier the BLS reported that August CPI rose 0.4% for the month and 3.4% over 12 months.
September 15: The Senate declined to advance the CLARITY Act. The Senate rejected cloture on the motion to proceed to H.R. 3633 by a vote of 49 to 50 against a three-fifths threshold in Roll Call 234. It was a procedural vote, not final passage. September 15 was also the month's price low and its largest ETF outflow day.
Strategy paused and then resumed buying. Strategy bought no Bitcoin from August 31 to September 13 while it repurchased STRC preferred stock. It then bought 950 BTC from September 14 to 20 and 1,665 BTC from September 21 to 27. Holdings rose from about 845,050 BTC to 847,666 BTC per its 8-K filings.
September 24: Bitget reported a hot wallet breach. Bitget reported unauthorized transfers from some of its hot wallets estimated at about $351.6 million. The exchange said its cold wallets were unaffected.
September 25: CleanSpark closed a $2.276 billion notes deal. A CleanSpark subsidiary closed $2.276 billion of 7.875% senior secured notes due 2031 per an 8-K filed September 25. CleanSpark now describes itself as a data center developer, one more public miner pointing capital at AI and data center buildouts.
Bitcoin Hashrate and Difficulty in September 2026
Bitcoin's network difficulty rose 5.52% in September 2026, from 125.81 T at the start of the month to 132.76 T after two upward adjustments. The first adjustment added 1.31% on September 5 at block 965,664 to reach 127.45 T. The second added 4.16% on September 19 at block 967,680 to reach 132.76 T. The hashrate estimate from mempool.space averaged about 944 EH/s for the month against about 911 EH/s in August.
Miners found 4,412 blocks from September 1 to 30 UTC, about 147 per day against the 144 target. Fees totaled 87.53 BTC for the month, or 0.63% of all miner rewards (August: 0.70%). The average fee per block was 0.0198 BTC. Miner revenue in September was almost all block subsidy at 3.125 BTC per block. A miner's take for the month came down to subsidy and price rather than mempool congestion.
Mining Pool Share in September
Foundry USA found 25.45% of September's blocks, followed by AntPool at 19.79% and F2Pool at 15.07%. The top three pools found 60.31% of all blocks mined in the month. Our Bitcoin mining pool stats show how hashrate splits across the pools today.
| Pool | September blocks | Share |
|---|---|---|
| Foundry USA | 1,123 | 25.45% |
| AntPool | 873 | 19.79% |
| F2Pool | 665 | 15.07% |
| ViaBTC | 393 | 8.91% |
| SpiderPool | 363 | 8.23% |
| MARA Pool | 232 | 5.26% |
Was Bitcoin Mining Profitable in September 2026?
Bitcoin mining was profitable in September 2026 on every machine in our table, with hashprice averaging $39.38 per PH/s per day. Margins ran from 19% to 62% at an all-in hosting rate of $0.065 to $0.08 per kWh. That average was 13.4% above August's $34.74, which reflects Bitcoin's average price rising 15.8% while average difficulty rose only 2.0%. Nearly all of that gain came from a jump between August 19 and 21. Within September, daily hashprice stayed between $37.49 on September 15 and $41.32 on September 21, and ended the month at $39.91.
Margins widened on every machine from August to September. At $0.065 per kWh the August margins were 57%, 46%, 39%, and 26% in the same order as the table below. The hosted columns price each machine at the all-in service fee for Bitcoin miner hosting in Iowa, $0.065 to $0.08 per kWh. The cost to mine a Bitcoin column counts the $0.065 fee only and leaves out hardware.
| Machine | TH/s | J/TH | Revenue per day | Margin at $0.065 | Margin at $0.08 | Cost per BTC at $0.065 | Break-even $/kWh |
|---|---|---|---|---|---|---|---|
| Antminer S23 Hydro | 563 | 9.5 | $21.95 | 62% | 53% | $30,264 | $0.171 |
| Antminer S21j XP Hydro | 495 | 12.0 | $19.30 | 52% | 41% | $38,224 | $0.135 |
| Antminer S21 XP | 270 | 13.5 | $10.53 | 46% | 34% | $43,002 | $0.120 |
| Antminer S21+ | 235 | 16.4 | $9.16 | 34% | 19% | $52,186 | $0.099 |
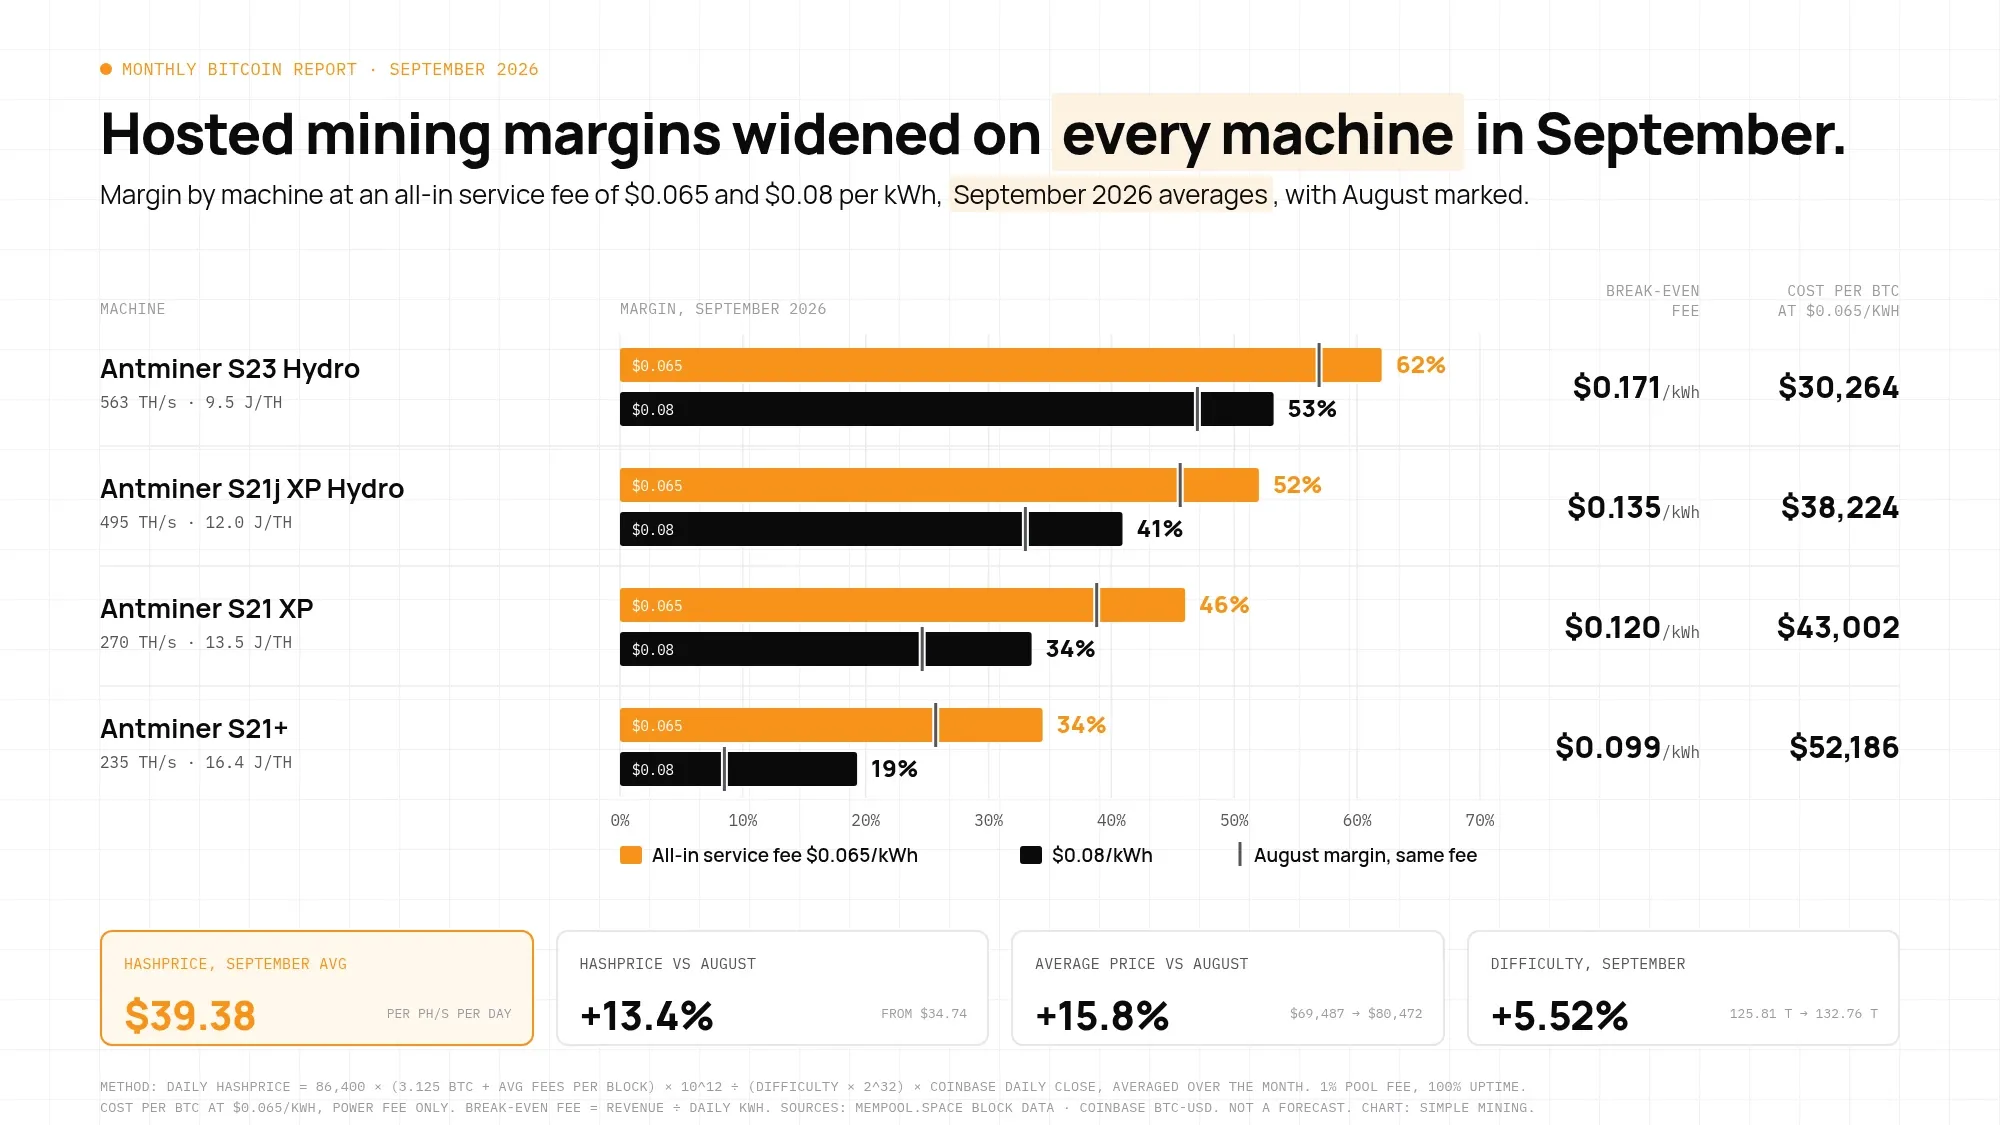
Every break-even rate in the table is below the $0.16 to $0.20 per kWh residential range except the S23 Hydro's at $0.171. The break-even column is the fee at which net per day hits zero. A home miner paying residential rates ran the S21+ at a loss in a month that paid a 34% margin hosted at $0.065.
How We Calculated These Figures
- Hashprice is calculated per day as 86,400 × (3.125 BTC + that day's average fees per block) × 10^12 ÷ (that day's difficulty × 2^32) times the day's Coinbase close. We then average the days over the month. It is the same formula our calculators use.
- Revenue applies a 1% pool fee and assumes 100% uptime. Simple Mining's fleet averages 95%+ uptime, so real results land below the table by that share.
- Cost per BTC is power cost only (kW × 24 × rate ÷ BTC earned per day), the same method as our cost-to-mine page. Hardware, taxes, and pool variance are excluded.
- ETF flow days follow US market hours while price weeks run on UTC, so the two week-by-week tables do not line up to the hour.
- These are September averages, not a forecast.
- Sources: Coinbase BTC-USD candles by day (UTC), mempool.space block data, TFTC ETF flow data (SoSoValue/Farside).
What to Watch in October 2026
October's difficulty adjustments fall at block 969,696 in the first days of the month and block 971,712 about two weeks later. Check today's network difficulty for the live figure rather than a percentage printed here.
- Bitcoin Core tagged release candidate v32.0rc1 in mid-September, and the published schedule aims to tag v32.0 on October 10 (Bitcoin Core GitHub issue #35122).
- The FOMC meets October 27 and 28.
- Public miners publish their September production updates in early October.
- The next halving is at block 1,050,000 and is expected around April 2028.
How Has October Gone for Bitcoin Since 2015?
Bitcoin closed October higher in 9 of the 11 years from 2015 to 2025 on Coinbase, the record behind the "Uptober" nickname. The two down years were 2018 at -4.55% and 2025 at -3.96%, so last October broke the run. The median October gain over that span was 14.44%. That history describes past Octobers and sets no target for this one.
| Year | Open | Close | Change |
|---|---|---|---|
| 2015 | $237.10 | $314.85 | +32.79% |
| 2016 | $608.99 | $696.90 | +14.44% |
| 2017 | $4,339.01 | $6,445.01 | +48.54% |
| 2018 | $6,605.00 | $6,304.18 | -4.55% |
| 2019 | $8,304.95 | $9,159.48 | +10.29% |
| 2020 | $10,779.63 | $13,804.81 | +28.06% |
| 2021 | $43,828.89 | $61,343.68 | +39.96% |
| 2022 | $19,423.57 | $20,489.94 | +5.49% |
| 2023 | $26,961.00 | $34,656.40 | +28.54% |
| 2024 | $63,305.52 | $70,197.83 | +10.89% |
| 2025 | $114,067.71 | $109,555.27 | -3.96% |
FAQs About Bitcoin in September 2026
What was Bitcoin's price at the end of September 2026?
Bitcoin closed at $83,556.14 on Coinbase as of September 30, 2026. That was a gain of 6.36% from the September 1 open of $78,562.74.
What was Bitcoin's highest price in September 2026?
Bitcoin's highest price in September 2026 was $87,397.00 on September 21. The same day was the month's biggest single-day gain at 6.70% and its largest ETF inflow day at $999.0 million.
How much money flowed into spot Bitcoin ETFs in September 2026?
Spot Bitcoin ETFs took in a net $2.65 billion in September 2026 over 21 trading days. IBIT led with $1,807.8 million while GBTC lost $259.3 million. Total net assets stood at $107.98 billion as of September 30, 2026, a figure that includes price moves.
What was Bitcoin's hashprice in September 2026?
Hashprice averaged $39.38 per PH/s per day in September 2026, or $0.0394 per TH/s per day. That was 13.4% above August's average of $34.74. The range ran from $37.49 on September 15 to $41.32 on September 21.
Was Bitcoin mining profitable in September 2026?
Yes. Every machine in our table earned a positive margin across our all-in hosting rates of $0.065 to $0.08 per kWh in September 2026. Margins ran from 19% on the Antminer S21+ at $0.08 to 62% on the Antminer S23 Hydro at $0.065. All four machines improved on their August margins.
Is September usually a bad month for Bitcoin?
September closed lower in 6 of the 11 years from 2015 to 2025 on Coinbase. September 2026 gained 6.36%, the best September since 2024's 7.35%. It is the fourth green September in a row.
Run September's Numbers on Your Own Machine
September paid hosted miners a wider margin than August on every machine in the table. What you can control is the fee you pay per kWh and the machine you run. Buy a Bitcoin miner from our in-stock inventory, or start with a 7-day free trial on an Antminer S21+ at 235 TH/s and watch the figures land in your own dashboard before you commit capital.