

Bitcoin Dominance Explained: What It Is and How to Read the Chart
By Josh Heine, Content Strategist at Simple Mining
Published July 15, 2026
Bitcoin dominance is the share of the total cryptocurrency market cap that belongs to Bitcoin. The metric tells you at a glance where capital sits between Bitcoin and every other coin. It started near 100% at launch and has held between about 50% and 65% in recent years. One number will not time the market for you. Dominance is a sentiment lens that rewards readers who understand what moves it.
On this page · 11 sections
- What Is Bitcoin Dominance
- How Bitcoin Dominance Is Calculated
- How to Read the Bitcoin Dominance Chart
- What High Bitcoin Dominance Means
- What Low Bitcoin Dominance Means
- Bitcoin Dominance and Altseason
- Factors That Influence Bitcoin Dominance
- How Bitcoin Miners Can Use Dominance Data
- Limitations of the Bitcoin Dominance Metric
- FAQs About Bitcoin Dominance
- Start Mining Bitcoin With Simple Mining
Key Takeaways
- Bitcoin dominance measures Bitcoin's market cap as a percentage of the total crypto market cap.
- The formula is (Bitcoin Market Cap ÷ Total Crypto Market Cap) × 100.
- Rising dominance signals capital concentrating in Bitcoin. Falling dominance signals capital rotating into altcoins.
- Levels near 70% and 40% mark the extremes of the range since 2017. Treat them as guidelines rather than trade triggers.
- Dominance can rise while Bitcoin's price falls. The metric measures relative share rather than absolute strength.
What Is Bitcoin Dominance
Bitcoin dominance is the percentage of the entire cryptocurrency market's value that Bitcoin represents. Traders shorten it to BTC dominance or BTC.D on charting platforms. The metric compares Bitcoin's market cap against the combined market cap of every tracked crypto asset.
Think of it as Bitcoin's market share. A reading of 60% means Bitcoin accounts for 60 cents of every dollar of crypto market value. The other 40 cents sit in altcoins, stablecoins and every other token combined.
Dominance moves for two reasons. Bitcoin's market cap changes or the rest of the market changes. That simple mechanic explains most of the confusion around the metric.
How Bitcoin Dominance Is Calculated
Bitcoin dominance equals Bitcoin's market cap divided by the total crypto market cap, times 100. Market cap is the price of a coin times its circulating supply.
The Bitcoin Dominance Formula
The formula fits on one line:
Bitcoin Dominance = (Bitcoin Market Cap ÷ Total Crypto Market Cap) × 100
Bitcoin's market cap is the Bitcoin price times the number of coins in circulation. The total crypto market cap sums that same figure for every tracked asset. Data platforms run this math for you in real time.
Example Calculation
Use round hypothetical numbers to see the mechanics:
- Bitcoin market cap: $1.2 trillion
- Total crypto market cap: $2 trillion
- Divide: 1.2 ÷ 2 = 0.6
- Times 100: Bitcoin dominance = 60%
Now hold Bitcoin's market cap flat and grow the total market to $2.4 trillion. Dominance falls to 50% even though Bitcoin lost no value. That one example captures the relative nature of the metric.
How to Read the Bitcoin Dominance Chart
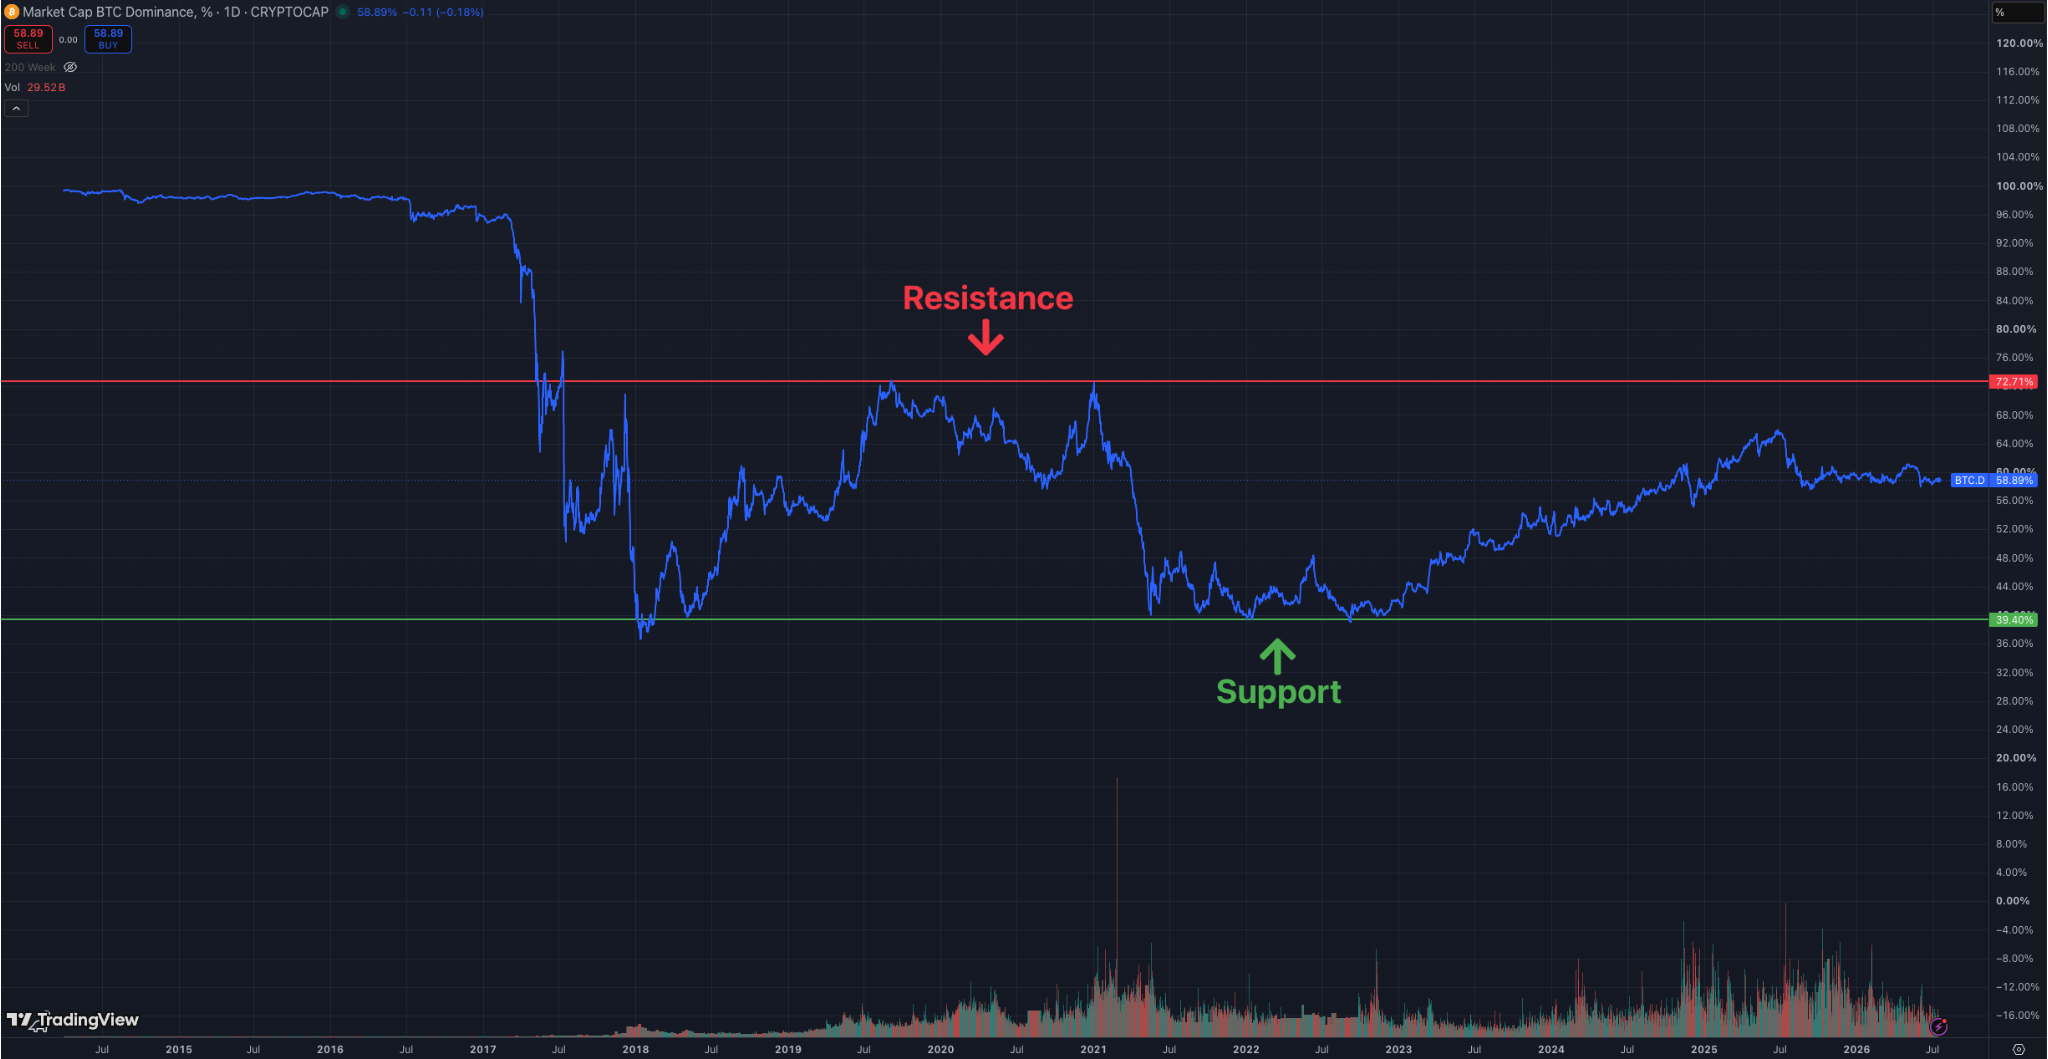
The Bitcoin dominance chart plots Bitcoin's market share as a percentage over time, with dates on the horizontal axis and dominance on the vertical axis. Pull up the live BTC.D chart on TradingView and follow along. Remember that the line tracks market share rather than price. A rising line can appear during a crash and a falling line can appear during a rally.
Identify the Trend Direction
Start with the direction of the line over weeks and months. A rising line means Bitcoin is gaining market share against altcoins. A falling line means altcoins are growing faster than Bitcoin. Day-to-day wiggles are noise. Trends measured in weeks show where capital is moving.
Spot Support and Resistance Levels
Support is a level where a falling metric has bounced before. Resistance is a level where a rising metric has stalled before. The dominance chart respects these zones the same way price charts do. Traders mark past turning points to anticipate where the current trend might pause or reverse. Treat the zones as areas of interest rather than exact lines.
Compare Dominance to BTC Price Action
Read the dominance chart next to the Bitcoin price chart. The pairing turns one signal into four scenarios:
| Bitcoin Price | Dominance | What It Suggests |
|---|---|---|
| Up | Up | Bitcoin leads the market higher |
| Up | Down | Altcoins outpace a rising Bitcoin |
| Down | Up | Altcoins fall harder than Bitcoin |
| Down | Down | Capital exits crypto across the board |
The divergence cases matter most. Bitcoin's price rising while dominance falls tells you the rally is broader than Bitcoin. Dominance rising while price falls tells you nothing in crypto is safe and Bitcoin is the least hurt.
What High Bitcoin Dominance Means
High Bitcoin dominance means capital is concentrated in Bitcoin relative to altcoins. Readings in the high 60s to low 70s have marked the top of the range since 2017. Those levels are guidelines drawn from history rather than rules. Context decides what any single reading means.
Capital Flowing Into Bitcoin
Investors favor Bitcoin over altcoins during uncertain stretches. Bitcoin has the deepest liquidity and the longest track record in the asset class. When conviction in the broader market fades the capital that stays tends to consolidate in Bitcoin.
Altcoin Underperformance
Altcoins lose market share whenever dominance climbs. They can still gain in dollar terms while losing ground to Bitcoin. The metric measures the race between the two rather than either one's absolute performance.
Risk-Off Sentiment in Crypto Markets
Risk-off describes periods when investors reduce exposure to speculative assets. Within crypto that means selling smaller tokens and holding the most established asset. Rising dominance is one of the cleaner footprints risk-off behavior leaves on a chart.
What Low Bitcoin Dominance Means
Low Bitcoin dominance means altcoins hold a larger share of total crypto market value. Readings in the low 40s and below have marked past peaks in altcoin speculation. The same caveat applies here. These are heuristics rather than triggers.
Capital Rotating Into Altcoins
Falling dominance shows investors allocating a growing share of capital to alternative cryptocurrencies. Altcoin dominance is the inverse metric. It measures the market share of everything except Bitcoin and rises whenever Bitcoin dominance falls. The two always sum to the whole market.
Altseason Indicators
Altseason is a stretch when altcoins outperform Bitcoin across the board. A steady decline in Bitcoin dominance over weeks is the most watched altseason signal. Traders pair it with rising altcoin volume before treating the move as confirmed.
Increased Speculative Risk Appetite
Low dominance reflects a market chasing higher-risk and higher-reward assets. That appetite tends to appear late in bull markets when confidence runs hot. The 2018 drawdown followed one of those stretches and remains the cautionary example.
Bitcoin Dominance and Altseason
Bitcoin dominance and altcoin performance move in opposite directions by construction. When altcoins grow faster than Bitcoin the dominance line falls. That inverse link is why traders treat the chart as an altseason gauge.
How Falling Dominance Signals Altseason
The mechanics are arithmetic. Altcoin market caps rising faster than Bitcoin's pushes Bitcoin's share down. A sustained slide in dominance during a rising total market is the textbook altseason setup. A slide during a falling total market means something different and darker.
Historical Altseason Patterns
Bitcoin held close to 100% dominance at its 2009 launch because no other coins existed. The share stayed above 90% until around 2014. The 2017 initial coin offering boom then pulled dominance from about 85% to below 40% by early 2018. That collapse marked the first true altseason.
The 2020 to 2021 window saw two forces pull in opposite directions at once. DeFi growth drew capital into Ethereum and other smart contract tokens. Institutional buyers like Tesla and Strategy, then still named MicroStrategy, pushed capital into Bitcoin at the same time. Dominance chopped between those forces rather than trending one way.
These rotations read against Bitcoin's four-year market cycle. Dominance has tended to climb early in a cycle and fade as speculation spreads outward. Long-run models like the Bitcoin power law describe Bitcoin's trajectory in dollar terms. Dominance describes its share of the crypto pie. Both views help and neither replaces the other.
Factors That Influence Bitcoin Dominance
Three forces drive most moves in Bitcoin dominance: new token supply, institutional flows and market cycles.
| Factor | Effect on Dominance |
|---|---|
| New altcoin and stablecoin launches | Tends to decrease |
| Institutional Bitcoin adoption | Tends to increase |
| Market cycles and sentiment shifts | Varies |
New Altcoin and Stablecoin Launches
Every new token adds market cap to the denominator without adding anything to Bitcoin. Thousands of launches dilute Bitcoin's share even when Bitcoin performs well. Stablecoin growth has the same dilutive effect on trackers that include stablecoins in the total.
Institutional Bitcoin Adoption
Large allocators concentrate in Bitcoin over smaller tokens. Bitcoin treasury companies and spot ETFs direct capital into Bitcoin alone. Those flows lift Bitcoin's market cap faster than the rest of the market and push dominance higher.
Market Cycles and Sentiment Shifts
Bull and bear phases pull the metric in different directions. Dominance has tended to rise early in bull markets and during bear market flights to safety. It has tended to fall late in bull markets when speculation spreads into altcoins. Cycle position shapes how the same reading should be interpreted.
How Bitcoin Miners Can Use Dominance Data
Miners use Bitcoin dominance as a market sentiment lens rather than a revenue signal. Mining revenue is earned in Bitcoin and priced by hashprice. Dominance appears nowhere in that math.
Why Dominance Is Not a Revenue Signal
Hashprice measures the dollar revenue a unit of hashrate earns per day. It moves with the Bitcoin price, network difficulty and transaction fees. None of those inputs appear in the dominance formula. Dominance can climb while Bitcoin's price falls because altcoins fell harder. A miner who reads rising dominance as rising revenue reads the chart wrong. Model actual economics in our Bitcoin mining calculator with hashprice and power cost as the inputs that matter.
Where Dominance Fits on an Operator's Dashboard
Dominance earns a spot as context. It shows where crypto capital is concentrating and how speculative the broader market feels. Some operators review it alongside hashprice when thinking through treasury policy or fleet expansion. The metric informs those conversations without deciding them. On our operations floor the numbers checked every day are hashprice, difficulty and uptime. Dominance gets a look about once a week.
Limitations of the Bitcoin Dominance Metric
Bitcoin dominance is a useful sentiment gauge with real blind spots. Knowing them keeps the metric in its proper lane.
Stablecoin Market Cap Distortion
Stablecoins sit inside the total market cap on some platforms and outside it on others. Dollar-pegged tokens represent parked cash rather than speculative altcoin demand. Their growth drags reported dominance down without any change in Bitcoin sentiment. Platforms also differ on wrapped, bridged and staked assets. Two trackers can show dominance a few percentage points apart at the same moment. Follow the trend on one platform instead of comparing exact numbers across platforms.
Does Not Measure Actual Bitcoin Strength
Dominance is a ratio. Bitcoin can lose dominance while gaining value in dollar terms when altcoins rise faster. It can gain dominance while losing value when altcoins fall harder. The metric says nothing about Bitcoin's absolute performance on its own. It also does not predict price direction. Pair it with price action and other indicators before drawing any conclusion.
FAQs About Bitcoin Dominance
What percentage is considered high Bitcoin dominance?
Readings in the high 60s to low 70s have marked the top of the range since 2017. High is relative to the metric's own history rather than a fixed threshold.
Is rising Bitcoin dominance bullish or bearish for altcoins?
Rising dominance means altcoins are losing market share relative to Bitcoin. It describes relative performance and does not predict what any asset does next.
How often does the Bitcoin dominance metric change?
Dominance updates in real time as crypto prices and market caps move. Trends measured over weeks matter more than single-day swings.
Can Bitcoin dominance ever return to its original level?
A full return to 100% is improbable with thousands of altcoins now in existence. Dominance can still rise a long way during risk-off periods.
Where can traders find a live Bitcoin dominance chart?
CoinMarketCap, CoinGecko and TradingView all publish real-time Bitcoin dominance charts. The BTC.D ticker on TradingView is the version traders reference most.
Start Mining Bitcoin With Simple Mining
Dominance measures the crowd. Miners measure hashprice. Reading market metrics well makes you a sharper mining investor and Simple Mining handles everything else. We sell new ASIC miners and host them at our US data centers. Our in-house certified ASIC repair bench keeps machines hashing without overseas shipping delays.
Simple Mining operates from Cedar Falls, Iowa with 9+ EH/s under management across 150+ MW. Fleet uptime averages 95%. Our Bitcoin miner hosting services run at $0.065 to $0.08 per kWh as an all-in, bundled hosting rate expressed in $/kWh. Precision billing means you pay only for actual uptime. Miners purchased through Simple Mining include Year 1 Repair Coverage with free repair labor.
Start with the free 7-day mining trial on 235 TH/s and watch a real machine hash from your dashboard before committing capital.